
Summary: in this step you will learn how to analyze and view the data you collect in your studies through the “Data & Analysis” and “Reports” modules. There are many ways to analyze data collected through Qualtrics. You will most likely use SPSS (“Statistical Package for the Social Sciences”) in Psych 201 (and then all of your 300 level courses), which your professors will be sure to teach you. This page, however, will explore the methods that Qualtrics offers.
Data & Analysis
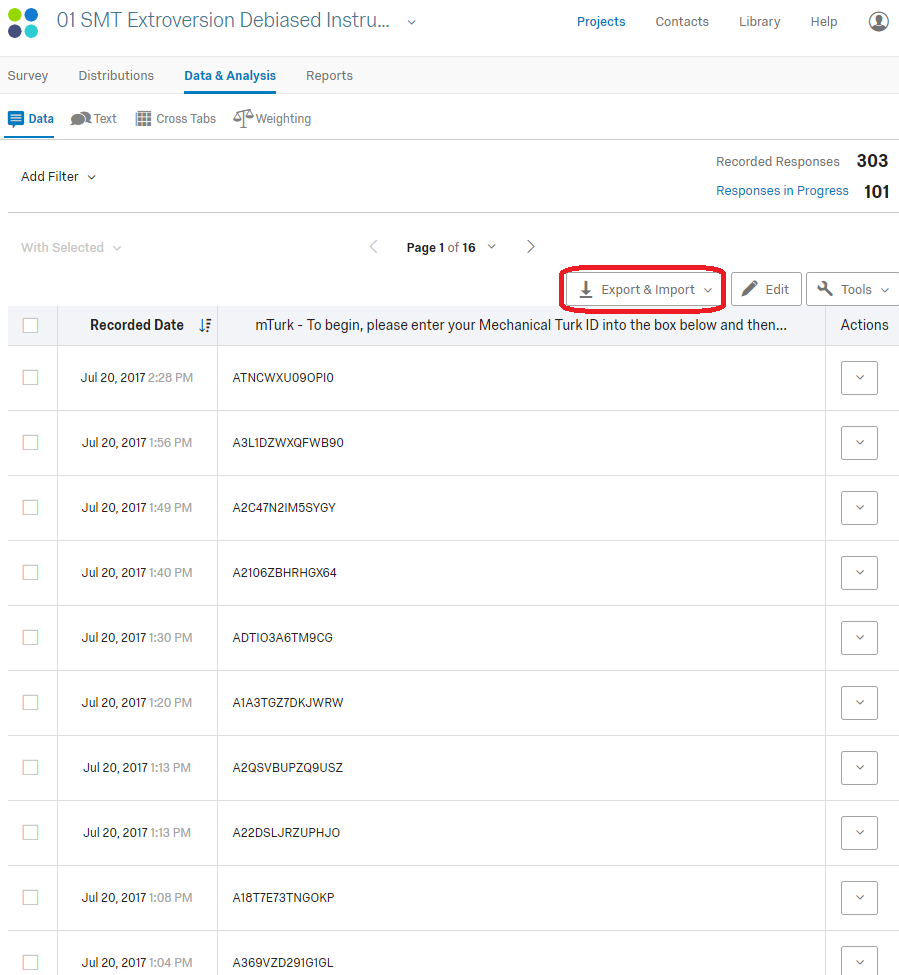
In this tab, you can view responses that have been submitted as well as responses which are still in progress. You can switch between these two different types of data in the upper right corner.
Completed responses are those that are closed and recorded in the data set. These include responses submitted when a survey is completed and partial responses that have been closed. You can click on responses to see exactly what the participant saw.
Responses in progress are those that have been started but not yet submitted or closed. These responses move to Completed when a participant finishes the survey or you close it manually via the check box on the left side.
You can do a number of helpful things in this module, like sort by question, add/customize the columns in the view window, add filters, and add custom fields.
The most important feature for a psych student in the Data & Analysis module is the export function. You will need to export your Qualtrics file before you can import it into SPSS. Click on the Export & Import button (shown below).
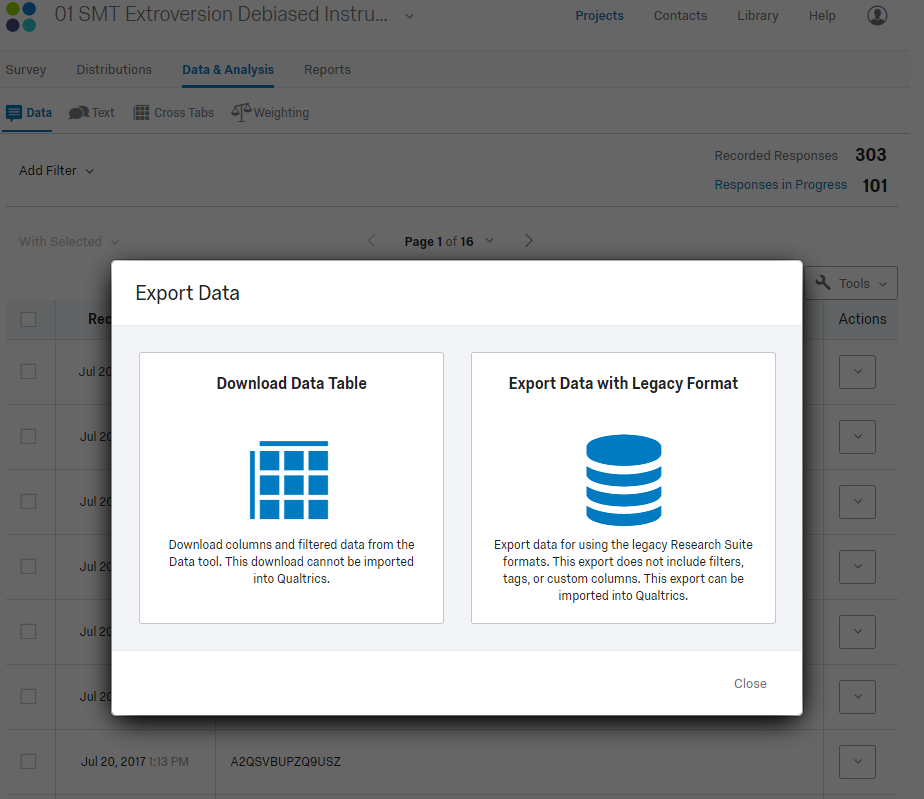
Choose “Export Data with Legacy Format.” Using this method, you can export the data in multiple different formats. The one you will most often use, as it can be imported into SPSS, is CSV (can also be opened in Excel).
Choose CSV.
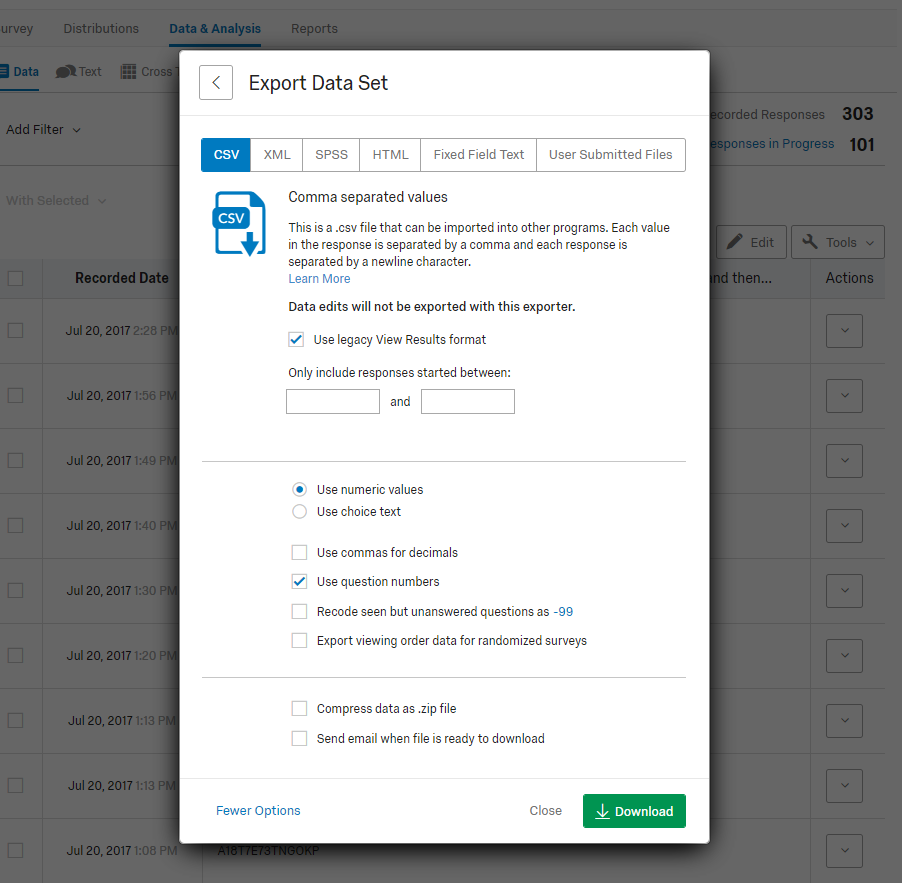
Click on “More Options” and verify that “Compress data as .zip file” is unchecked. Then you can click “Download.”
Once you have done this, you may have to use a .filecombiner script in MatLab to combine multiple surveys if that is the case. If so, ask your professor for help. They will know if that is necessary.
Reports
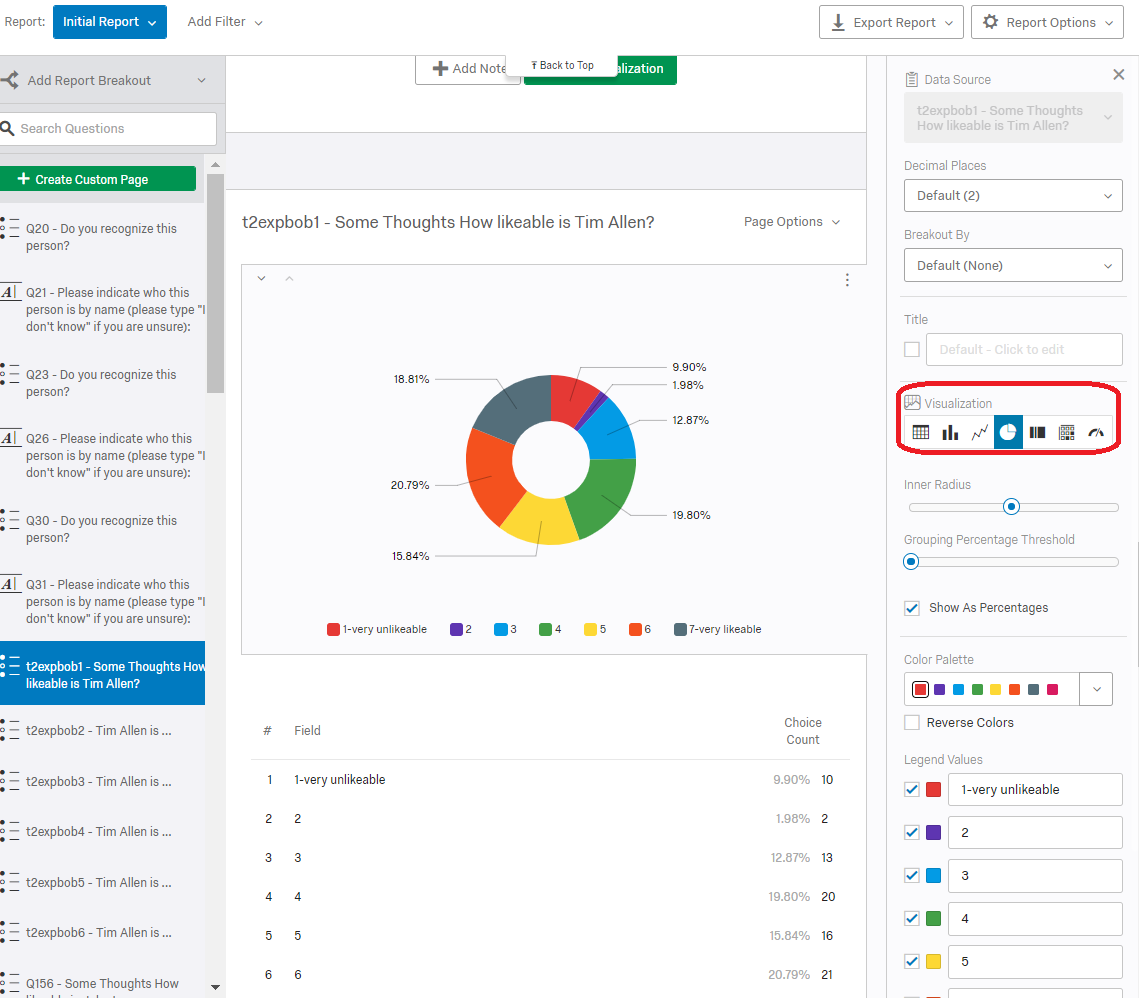
This tab allows you to easily view, explore, and analyze your data. On the far left, as seen below, is a list of the questions in your survey. By clicking on any of these questions, you can see the report on the right. There are many ways of viewing your reports as well.
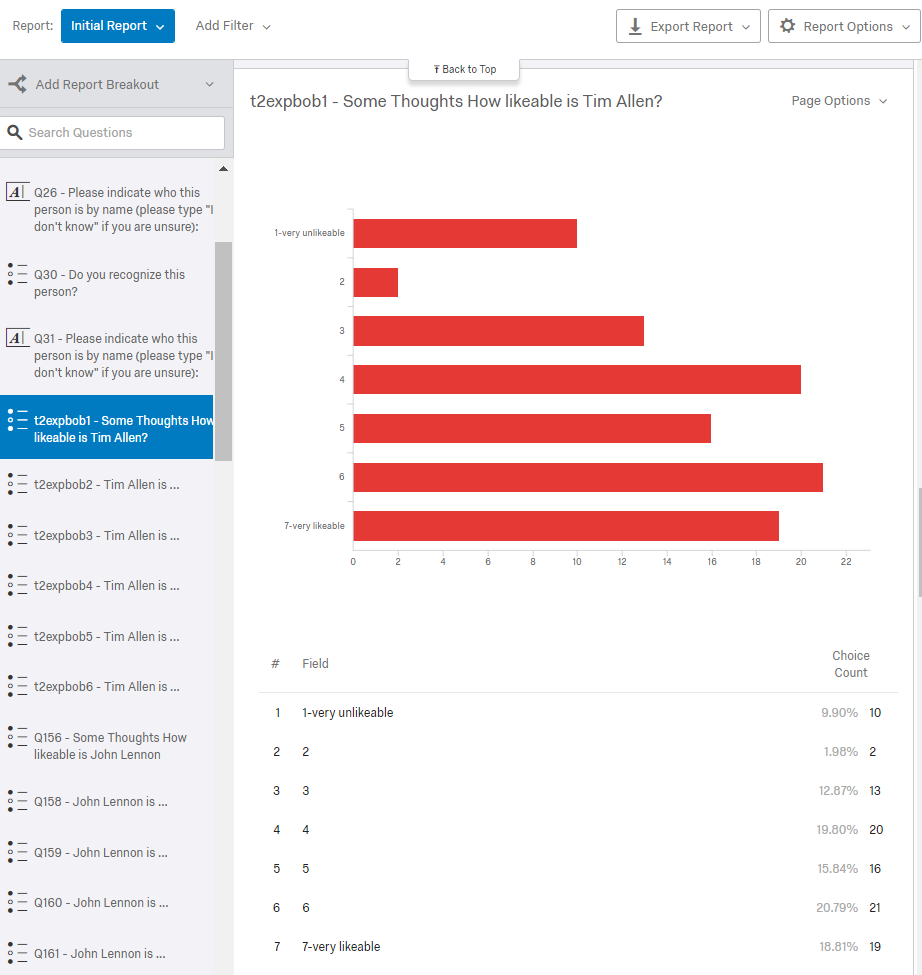
To the right is the visualization Editing Pane, which changes depending on which visualization is chosen. For example, the visualization chosen above is Bar chart. You can add as many visualizations as you’d like by simply clicking on “Add Visualization” below the previous report.
Each question has a default visualization setting, which may or may not work for what you’re looking for. Therefore, you can change the default setting to any of the following options (for Multiple Choice questions): Bar Char, Line Chart, Pie Chart, Simple Table, or Breakdown Bar. For Text Entry questions, you can choose between a Word Cloud of a Paginated Table.
You can rename and edit your reports within Qualtrics. This is most useful for surveys in which the information lacks nuance. This function also allows you to catch a glimpse of the data prior to conducting statistical analysis in SPSS. You will most likely rarely use this function of Qualtrics, but here’s how to use it anyway.