
Summary: when you conduct a Qualtrics survey, it is crucial to edit the exported data file before importing it into SPSS for a statistical analysis. Here are some helpful tricks for how to organize the excel sheet for analysis.
Steps to edit excel for analysis:
- The first step is to download the data from Qualtrics, which has been outlined for you on the page: Step 5: Analyzing Data.
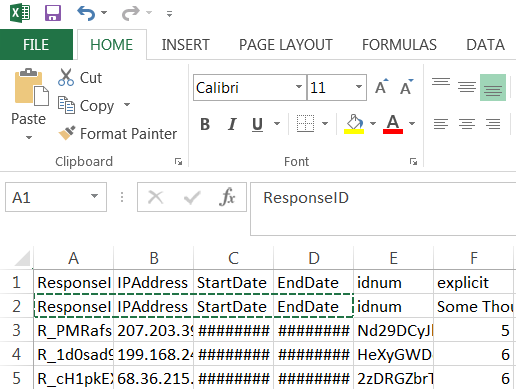
- Once you have downloaded the csv. you will open up a file that looks like this:
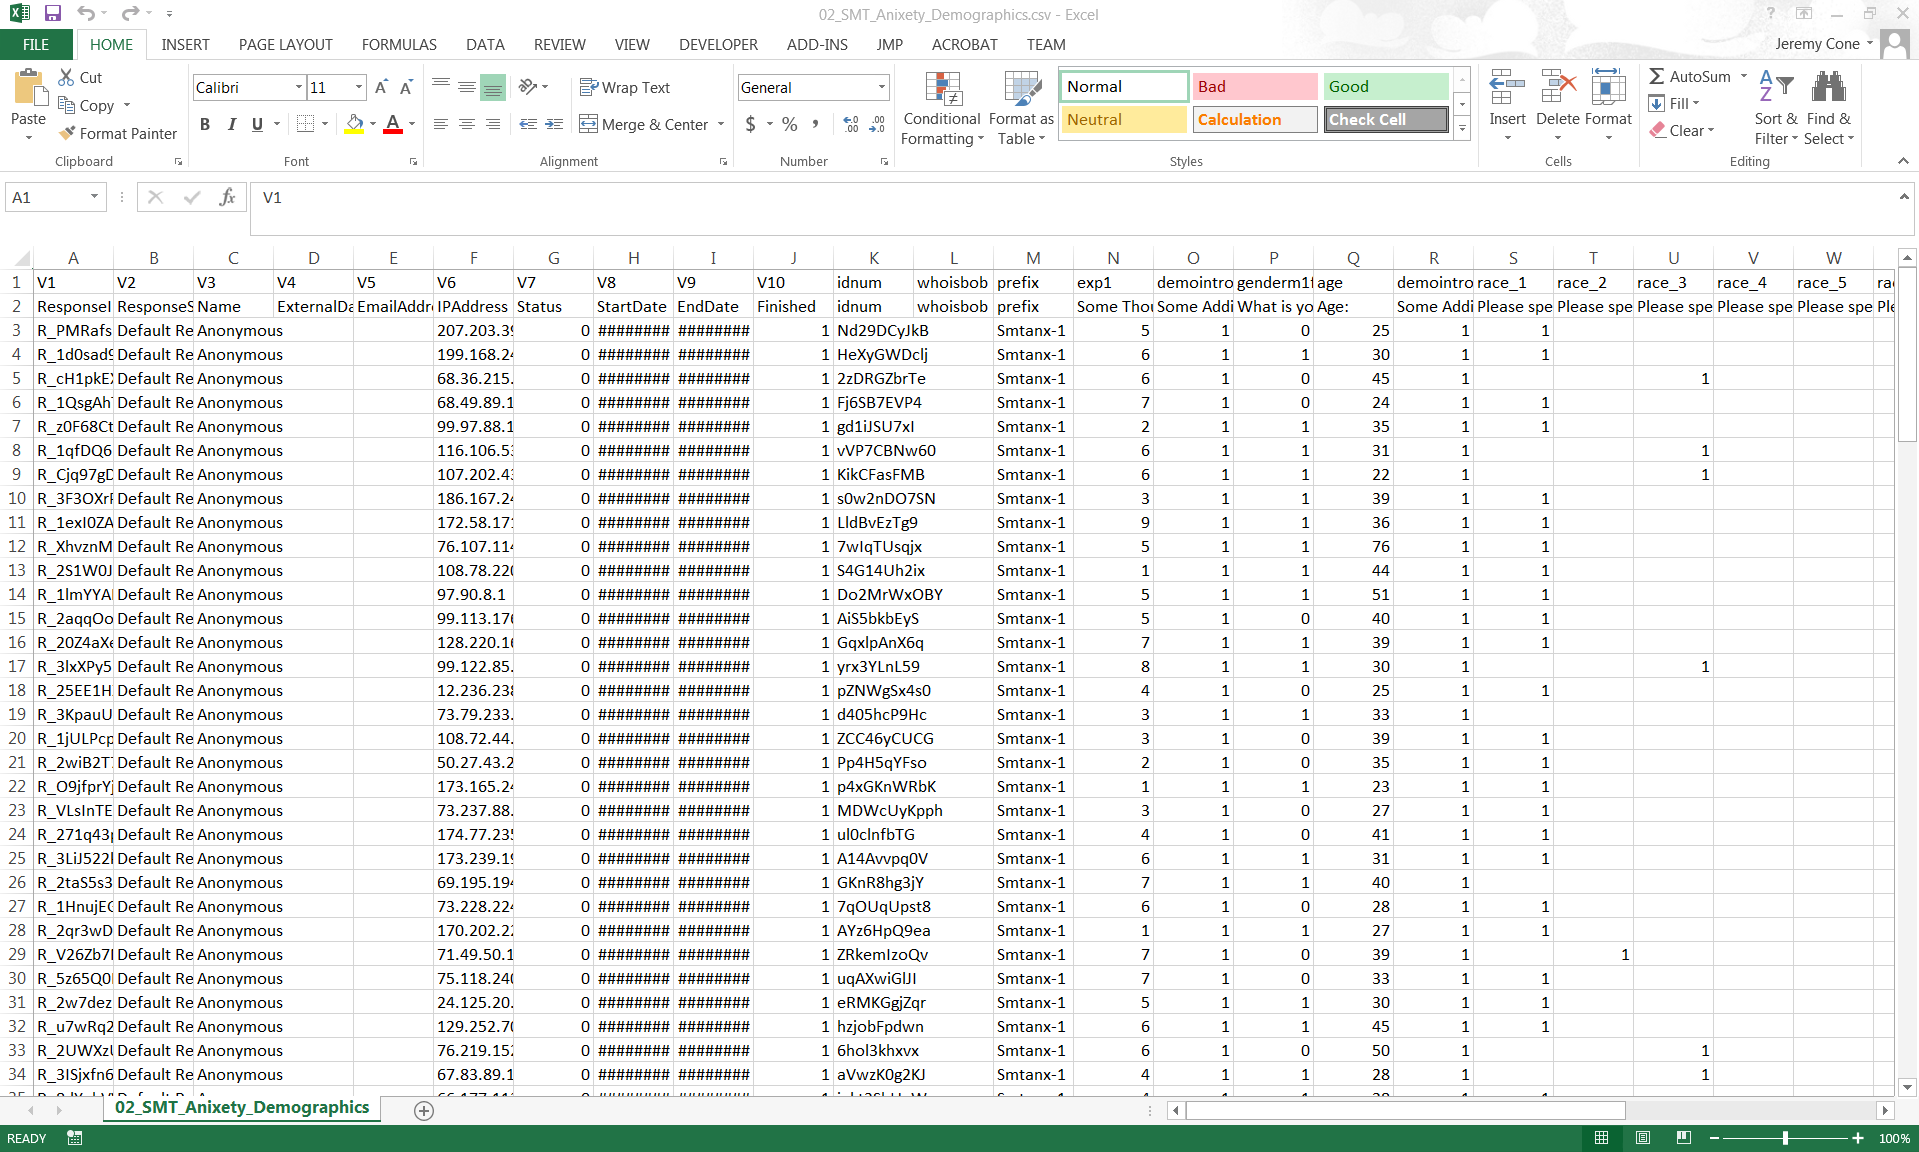
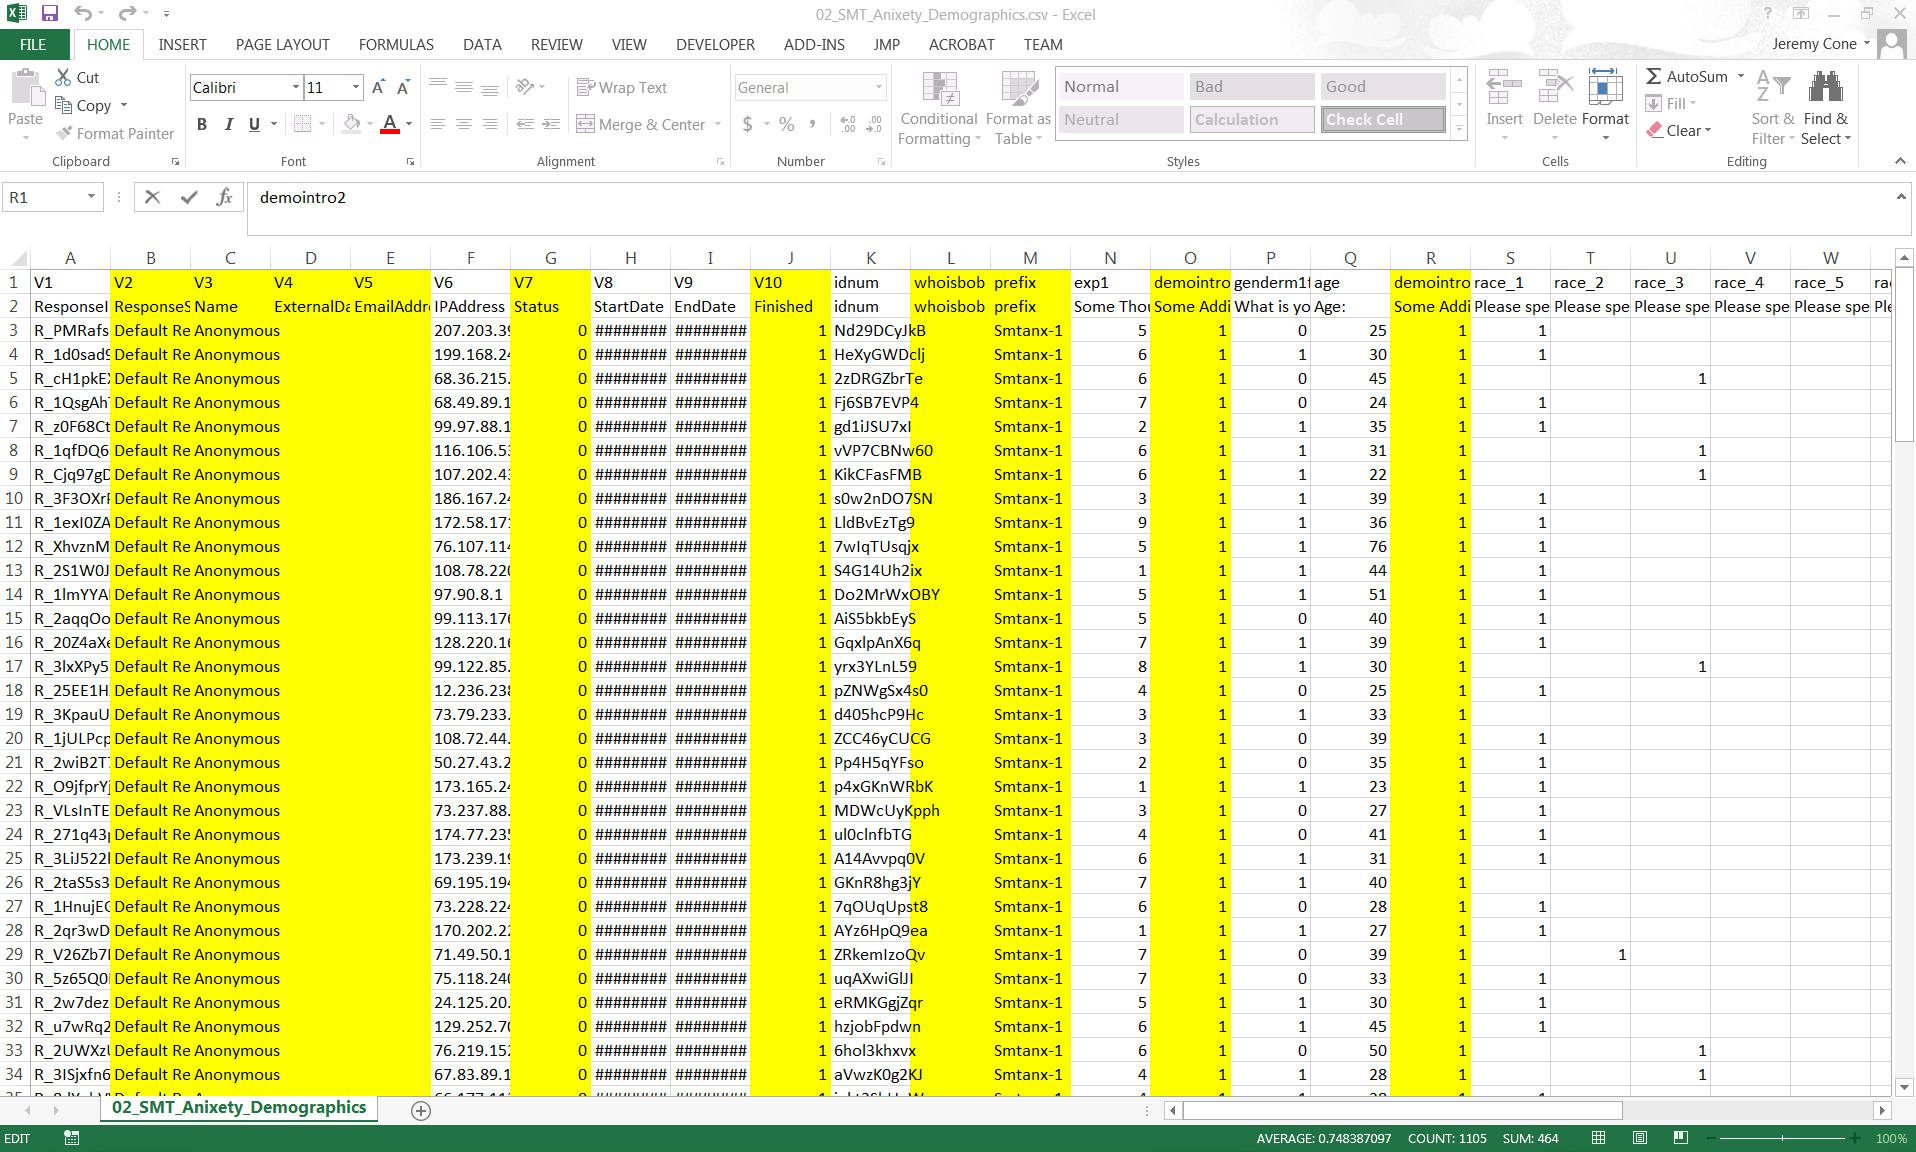
- The first thing you will want to do is to delete all of the columns which contain repetitive or unnecessary information. As you can see from the image below, these are examples of columns in an Qualtrics sheet that are often unnecessary for a statistical analysis in SPSS. You want to highlight these columns by clicking on the letter at the top of it, then right click it and choose delete. You should delete columns that do not have data in it (ex: “ExternalData”) or that has the same information for all of the subjects (“V7 – Status”). Examples of these types of columns have been highlighted for you below.
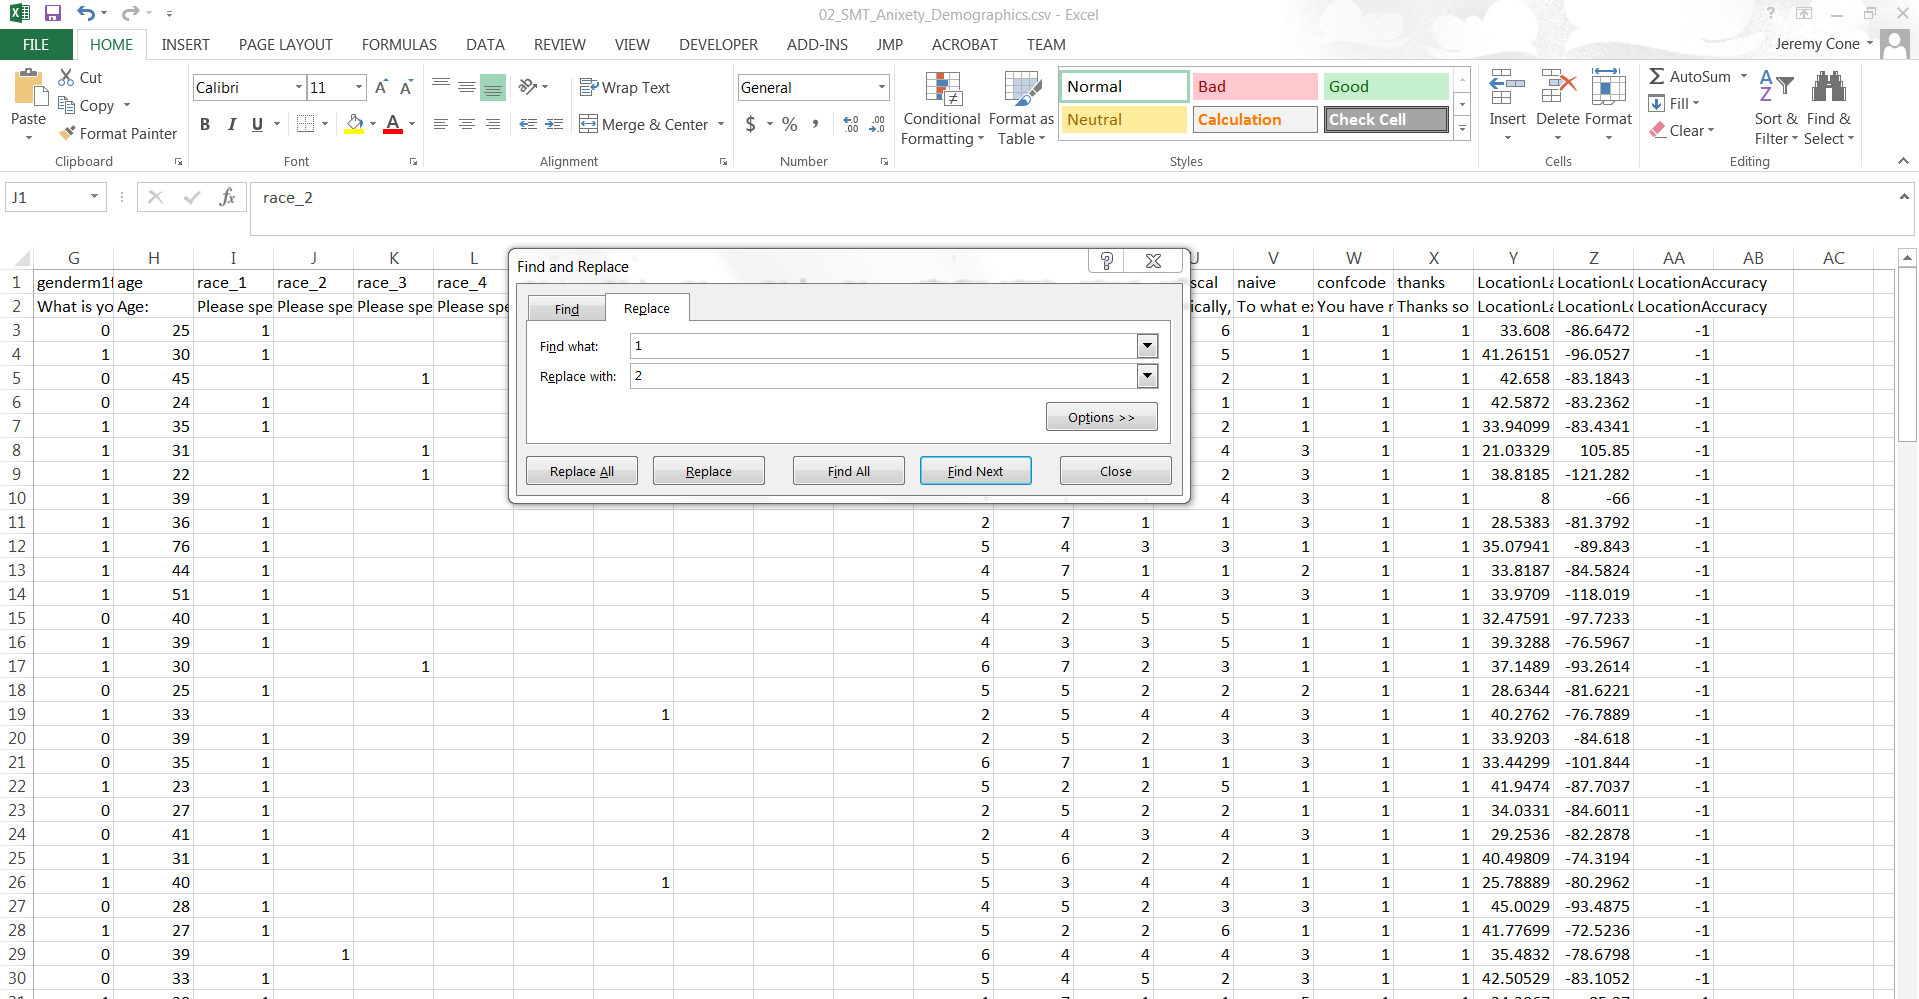
- The next thing you’re going to want to do is to condense the “race” options from your demographics into a single column. There are few steps you need to take in order to make this work. Begin by changing all the “1s” in the columns labled race_2, race_3, etc. with the number corresponding to the title. You can see an example below. You can do this by selecting the column and pressing Ctrl > H to Find and Replace all the 1s with 2s, 3s, 4s, etc. Once you are finished with that you will need to add a new column to the right by right clicking on the next column and choosing Insert.
- Label this column “race.” The next line below it will be the formula “=J3&K3&L3&M3&N3&O3&P3&Q3.” You may have to substitute these letters with the corresponding ones in your respective file.
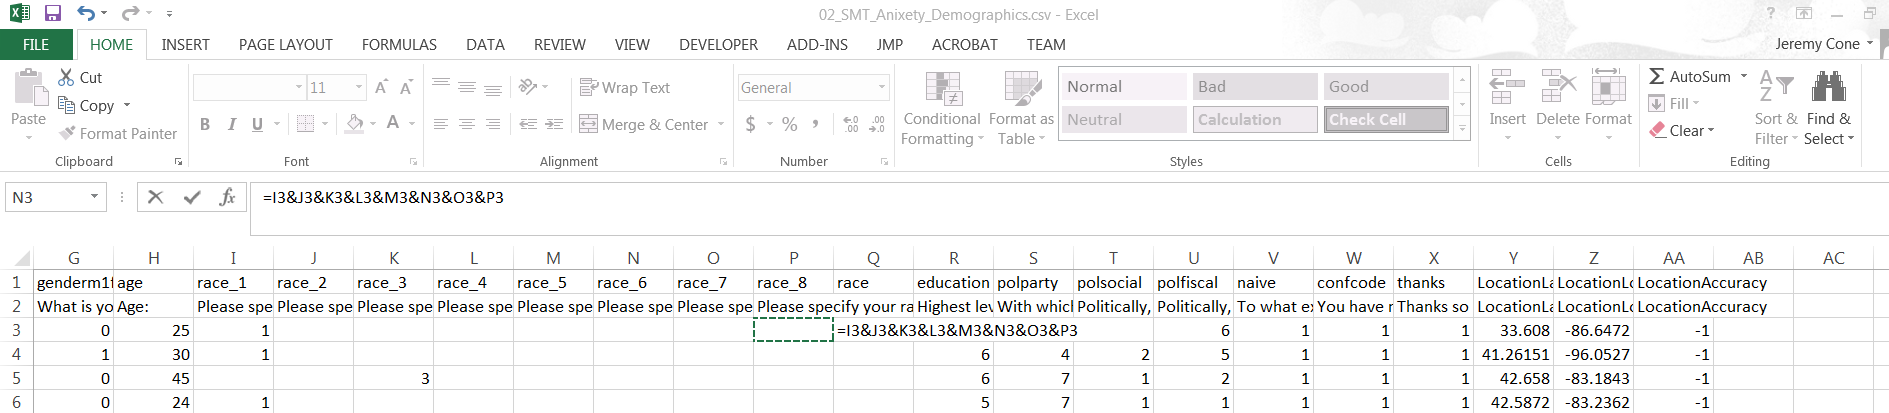
- Navigate to the cell and hover until you get a mouse that looks like a cross and double click. Now the whole column should contain this formula in all of the cells.
- The last step is to copy these values (independent of the formula) into a new column. Create a new column by once again right clicking on the next column and choosing insert. Next, copy your “race” column and paste the values into the new column.
- Now you can delete all of the other race columns. It should look something like this.
- Label this column “race.” The next line below it will be the formula “=J3&K3&L3&M3&N3&O3&P3&Q3.” You may have to substitute these letters with the corresponding ones in your respective file.
- The last step is to change all of the titles so that they make sense to you. See the image below for an idea of what this means. When you’re done, you can delete the second row.
- Now you are ready to “Save As” an xlsx. file and import into SPSS.
Here’s a tutorial of how to do what has just been described!