Our Summer 2020 Outlook

Dear Readers,

Below is a collection of “blurbs” as we call it: brief snapshots and hot takes on a variety of market-related topics. From analyses on Bloomin’ Brands’ role in the restaurant space to the future of mortgage backed securities, we hope our short pieces will provide you with some Insight on the way we’re viewing market movements in the coming months.

Enjoy!

– The Insight Leadership Board

Our Fed-Fueled Outlook for Navigating a V/W/L/U Shaped Recovery

By Maria Chapman and Saamia Khan
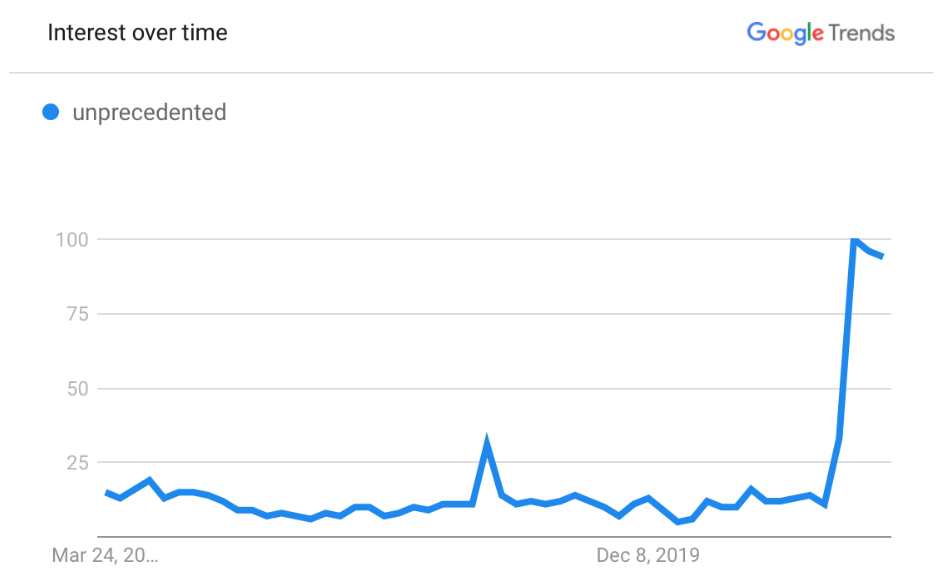
Figure 1: According to Google Trends, use of the word “unprecedented” has skyrocketed since early March, right when the global pandemic forced countries all over the world to go on lockdown

Along with other “unprecedented” situations we’ve seen in the first half of 2020, the Fed has stood out for its extraordinarily unprecedented measures over the last few months in its attempt to triage the effects of Covid-19 on the global economy. In the past few months, we have seen the central bank acting proactively to quell the financial panic that ensued as the U.S. and other countries began lockdown, holding true to its mantra of forward guidance. On March 15, 2020, we saw many of the expected moves: targeting the Fed Funds rate to effectively zero, removing the reserve requirement, declaring a new round of quantitative easing (QE), and encouraging the use of the discount window. The actions that have followed can certainly be categorized as “unprecedented.” The Fed has taken it upon itself to ensure unlimited liquidity in the markets by buying up assets in areas they have never before touched (i.e. municipal bonds, ETFs, individual corporate bonds). 

While the Fed has succeeded in making market participants jubilant, we as Insight-ers have had countless conversations about whether or not the market valuations we are seeing are indeed reflective of corporate, and overall economic health. One particular area of concern, as Janet Yellen pointed out on March 30, 2020 during a Brookings Institution video broadcast, are the ever-rising levels of corporate debt. Prior to the coronavirus, a low interest rate environment coupled with investor demand for return encouraged firms to issue massive amounts of debt, often to repay old debt, pay dividends or perform stock buybacks. With companies having to issue even more debt to stay afloat, we could be in for a shock with a surge in company defaults. We are already seeing a massive rise in company bankruptcies. 
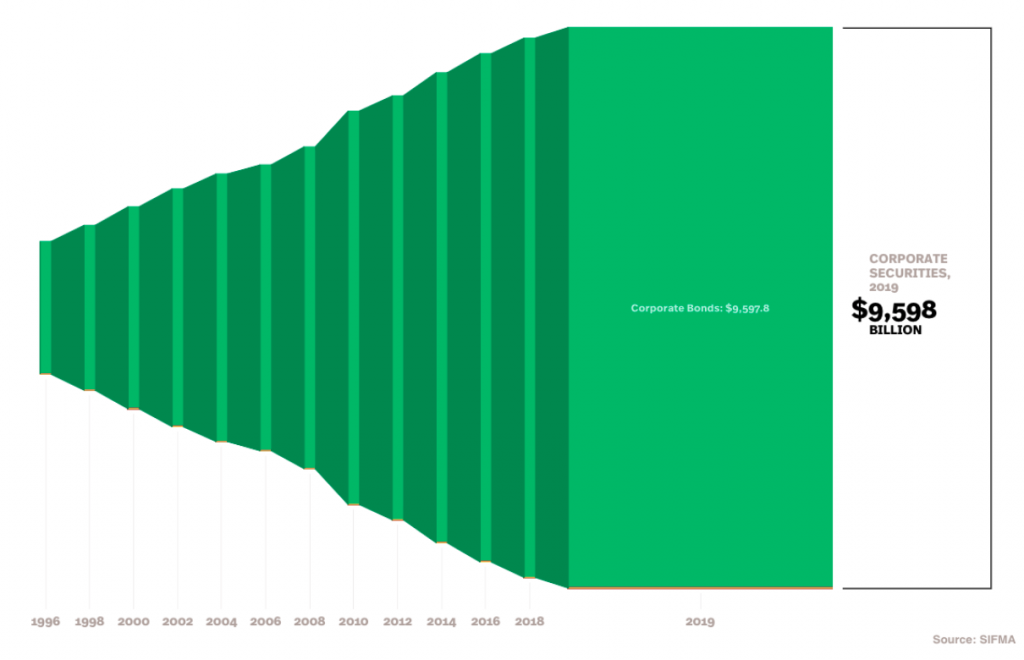
Figure 2: Corporate debt levels have risen from $5.5T in 2008 to $9.6T in 2019—the Fed’s recent actions in creating a low interest rate environment will only cause this trend to continue


Another foreseeable risk is the illusion of a healthy market as the technology sector outperforms others. The five largest companies in the S&P 500 are in tech and make up about 20% of the market value of the index. Retailers like JC Penney and Pier 1 Imports have filed for bankruptcy while Macy’s (NYSE: M) is down more than 60% since February. Meanwhile, tech giants such as Apple, Amazon, Netflix and Zoom stock have been continuously hitting all-time highs despite the pandemic. Although tech may be the future of our world, the present reality is that the significant performance drops in other sectors such as retail, transportation and travel are affecting the market, even if it’s not always apparent. 

We want to emphasize that the Fed has certainly shown that it is more than willing to support the country’s economic recovery through forward guidance. At the same time however, there are inherent risks to striving for a perfect V shaped recovery, risks that should certainly not be overlooked when assessing our market play for summer 2020. Ultimately, we believe no number of stimulus packages nor asset purchases can alleviate the human health-related woes that have inflicted our once strong economy. But shoutout to Jerome Powell for leading us through a volatile first half of 2020 and ensuring liquidity in the markets. 

Are MBS-Related Fears Warranted?

By Nathan Szeto

With the recent outbreak of the novel coronavirus, businesses of all kinds have taken to a remote style of work that has resulted in many office buildings being vacated and leases cancelled. Many homeowners, having lost a steady source of income, have found themselves unable to make payments on their mortgages. This situation has led many to question the future prospects of mortgage-backed securities (MBS). More specifically, will MBS cause another financial disaster like that of 2008? The answer is almost certainly no.

First, an important distinction must first be made between agency and non-agency MBS. Essentially, agency MBS are backed by the U.S. government via Freddie Mac and Fannie Mae and constitute 63% of the $11.1 trillion mortgage market as of now. The Fed is currently purchasing MBS and Treasuries at a rate of about $120 billion a month in order to keep the markets running smoothly. Non-agency MBS, aka private-label MBS, are those issued by entities other than Freddie Mac and Fannie Mae and therefore lack the backing of the U.S. government.

Concerns have been raised about non-agency MBS and more specifically the creditworthiness of certain borrowers in what seems to be a situation similar to that of 2008. In fact, ProPublica reports that housing prices have been subject to up to 30% inflation by banks in order to make properties seem more valuable than they actually are. However, what is important to note is that in 2007, there was $2.4 trillion in non-agency MBS, while in 2019 that figures stood at $443 billion. This fact, in addition to the reality that little evidence for the existence of a “housing bubble” exists, leads to the conclusion that even if the non-agency MBS market collapsed, the impact on the economy would not come close to that of the 2008 financial crisis.

One last topic of interest is the awkward position in which mortgage servicers have been placed. The recent CARES Act stimulus package has mandated that all federally-backed mortgages can enter forbearance for a period of one year. While this package is obviously beneficial for homeowners who as a result can continue living in their homes, it puts a great burden on mortgage servicers as they are still expected to make payments to investors for a period of four months after loans become delinquent or enter forbearance. Already at least 7.54% of all mortgages have entered forbearance and that number is expected to grow as the pandemic continues, according to the chief economist at the Mortgage Bankers Association. The increased risk of mortgages has resulted in more stringent regulations for potential borrowers that may persist even beyond the current crisis, according to the economic forecasting firm Oxford Economics. In any case, while the stimulus package does not provide funds to mortgage servicers, loans in forbearance as well as delinquent loans will now be allowed to remain in MBS pools beyond the typical 4 month period. Lastly, to support the functioning of the mortgage market, Fannie Mae and Freddie Mac have been authorized to purchase loans in forbearance according to the Federal Housing Finance Agency.

Flying Blind: Trading Airline Stocks

By Michael Davis

Despite an expected 90% revenue drop for Q2, the airline industry’s stocks have begun to take off, with stocks like American Airlines (AAL) up over 100% from their COVID low. Much like the virus itself, however, the market is fickle. As of today (7/2/20), AAL now sits at $12.50, down 38.5% from a month ago. Now you, dear reader, may be asking: what to do with this volatile yet necessary industry? Short answer: look out for breaking news.

As a whole, the big five stocks in the airline industry are JetBlue (NAS:JBLU), American Airlines (NAS:AAL), Delta (NYSE:DAL), Southwest (NYSE:LUV), and United (NAS:UAL). Within this top five, JetBlue and Southwest standout as the most positive buys. JetBlue has no debt and its EV/EBITDA of 5.29 is well below the transportation industry median of 8.77. Southwest, on the other hand, has a cash-to-debt ratio of .87, well above the transportation industry median of .26 and has a an EV/EBITDA of 5.79, again below the industry median of 8.77. The other three, while larger industry players, all operate with much less cash/more debt and at comparatively worse EV/EBITDA ratios, meaning that while they will stick around, their business models are likely to be impaired for far longer.

As the market stands now, it seems that airline stocks, much like the rest of the market, are handcuffed to any COVID-related news. Vaccine possibility? Look for a rise. Dr. Fauci says there’s an imminent second wave? Look for the fall. After all, air travel is necessary, and as they stand, most airline stocks are probably undervalued. That said, air traffic most likely will not return to its pre-COVID volume for three or more years, meaning that stock movements will be underpinned not by company performance, but by the market’s predictions for the future. The bottom line? Buy with one hand but have the other one ready to sell.

Not-So Bloomin’ Brands?

By Danny Irvine and Chris Bassett

As a result of COVID-19, many firms in the food industry have been hit hard financially from the lack of foot traffic of quarantining and social distancing.  Some have fared better than others thus far, with the restaurants already proficient in takeout and delivery such as Domino’s Pizza able to operate more normally than those who offer more of a dine-in experience.  

Bloomin’ Brands is a restaurant holding company that owns several American dine-in restaurant chains, including Outback Steakhouse, Fleming’s, Bonefish Grill, and Carrabba’s Italian Grill, typically located in the Northeast.  These are higher-end chains, meaning they rely less on takeout as customers prefer the experience of more expensive food in a dine-in restaurant environment.  Now, restaurants around the country are starting to open more and more of their locations as social distancing restrictions are lessened.  It is unclear how the public will respond at this point in time as fears of the virus may prevent sit-down dining from being as prevalent as before, however there are a few reasons why Bloomin’ Brands may be positioned better than its competitors.

Just prior to the pandemic hitting the US, Bloomin secured a long-term exclusive deal with delivery service, DoorDash, for their Outback Steakhouse brand. The partnership ensures that despite the pandemic, customers can still purchase from Outback, adding an additional component to Bloomin’s revenue stream that their CEO, David Deno, could not have predicted would be especially useful during the proceeding pandemic. 

Because Bloomin brands has access to cash, it is more likely to withstand the pandemic. Similar to the majority of companies over the past few months, Bloomin Brands took a loss during the first quarter of 2020 of $34mm, which distinctly contrasts their prepandemic quarterly net income of $65mn. However, over the last few months Bloomin raised $505mm in debt, and after using a portion of that sum to repay some previous borrowings and addressing other financial obligations, they have a $336mn net increase in cash this quarter, which means they have an additional $321mm in cash compared to this time last year. Because their financials were strong prior to the pandemic, they could take on debt to keep their various brands afloat. Bloomin Brands has made between ~$100mm and ~130mm in annual net income each year over the last three years. Therefore, the debt that they took on can be easily paid off over time, once they can safely serve customers in their storefronts again. Thus, although the pandemic wiped out their profitability this quarter, Bloomin brands was able to secure sufficient funding via debt to stay afloat that they can effectively pay down when their normal streams of income return. Notably though, it will take some time to pay down this new debt, meaning that a full recovery for Bloomin looks to be 5-7 years out.

Looking Beyond: A Glimpse into BYND

By Mohammad Mehdi Mojarradi and Michael Bedard

Beyond Meat (BYND) is a rising plant-based food company that went public in Q2 of 2019. BYND’s diversified revenue stream has allowed it to stay afloat during the COVID-19 crisis. Despite 42% of its revenue coming from food services, the hit on restaurants has not had a debilitating effect on BYND unlike some of its competitors, namely Impossible Foods. The company’s primary source of revenue, grocery stores and supermarkets (58%), have been relatively steady. In fact, while BYND reported an adjusted EBITDA loss of $2.1 million in the year-ago period, their Q1 2020 adjusted EBITDA was reported at $12.7 million, despite restaurants getting destroyed as a consequence of COVID-19. Evidently, BYND handled the massive shift in demand from food service to retail adequately. It is important to note that since COVID-19 became a global issue only in the last two weeks of Q1, BYND’s performance in Q1 cannot be viewed entirely in conjunction with COVID-19. However, because it can be for Q2, we believe BYNDs performance in Q2, which has been promising thus far, will be most telling of how the company will emerge from this crisis.

As of March 28th, BYND reported that it has taken adequate steps to ensure liquidity in the wake of the Coronavirus outbreak with roughly $250 million in cash with an outstanding debt of just over $30 million. With their fiscal safety secured, BYND leadership has said that part of their plan is expansion into real-meat territory as several meat processing facilities in the U.S. have large outbreaks. According to Tyson Foods executives, roughly half of the company’s pork processing capability has been halted due to these coronavirus outbreaks in their facilities. As gaps in the market open, BYND hopes to slide in by providing larger-than-normal discounts on their products to big retailers in an attempt to minimize the price difference between their product and beef. Currently pricing their products at around double or triple the price of regular beef products, BYND can stand to make solid territorial and financial gains in the upcoming quarters as they lower prices and become more appealing to the average consumer.

Wrapping Up: Two Cents from Jack Sercu ’22

By Jack Sercu

All, I hope you’re well and staying safe at this time. An economic outlook is intriguing to write at this time, and I think cannot be properly considered without looking at the social change our country is currently going through. I believe we are perfectly positioned as liberal arts students – at an extremely diverse institution – to weigh the various factors and come up with a vision for the future. I will look at two different categories and how they will alter the business environment of the future. First, I will examine the push for ends to systemic racism and injustice. Second, I will look out for when we do rebound from COVID, which is not an exact time period, but more so the year after the country/world opens up again. So, without further ado, my fellow Americans, Jack Sercu’s economic outlook/two cents. 

It would be ignorant to speak of the future without looking at how the changing political sentiment in our country will affect business. The resource gap for minorities is completely tied to income – no law in it of itself states that blacks should receive worse education, healthcare or other support. However, due to America’s gut-wrenching history where our systems did prevent certain races from most resources/privileges, these gaps have held pretty steady. Picture doing a 100m race where white people start 50m ahead. Anyways, the wave we have witnessed on social media from a combination of friends and celebrity endorsements is to support minority owned local businesses. I believe reallocating your resources as such is a fantastic way to empower minorities. This will not breakup big business and topple capitalism, but I do believe it will lead to more balance between small and large. Attention to small businesses has increased because of COVID, as many have witnessed their favorite local spots struggling or going out of business and are more aware of their power as consumers… Continued here.

 

Wrapping Up: Two Cents from Jack Sercu ’22

All, I hope you’re well and staying safe at this time. An economic outlook is intriguing to write at this time, and I think cannot be properly considered without looking at the social change our country is currently going through. I believe we are perfectly positioned as liberal arts students – at an extremely diverse institution – to weigh the various factors and come up with a vision for the future. I will look at two different categories and how they will alter the business environment of the future. First, I will examine the push for ends to systemic racism and injustice. Second, I will look out for when we do rebound from COVID, which is not an exact time period, but more so the year after the country/world opens up again. So, without further ado, my fellow Americans, Jack Sercu’s economic outlook/two cents. 

It would be ignorant to speak of the future without looking at how the changing political sentiment in our country will affect business. The resource gap for minorities is completely tied to income – no law in it of itself states that blacks should receive worse education, healthcare or other support. However, due to America’s gut-wrenching history where our systems did prevent certain races from most resources/privileges, these gaps have held pretty steady. Picture doing a 100m race where white people start 50m ahead. Anyways, the wave we have witnessed on social media from a combination of friends and celebrity endorsements is to support minority owned local businesses. I believe reallocating your resources as such is a fantastic way to empower minorities. This will not breakup big business and topple capitalism, but I do believe it will lead to more balance between small and large. Attention to small businesses has increased because of COVID, as many have witnessed their favorite local spots struggling or going out of business and are more aware of their power as consumers. The guilt or discomfort that many feel can also be satisfied through spending, and I think this is an underrated factor that will help change. Simply put, people being able to tell themselves “I buy food from the local black-owned deli, I buy cannabis (legally) from the local black-owned dispensary (which I have seen many Seatteites encourage their friends to do), etc” will actually make a difference. That isn’t the best method to change our mentalities, but I do think it is a good supplementary action – put your money where your mouth is! Well done > well said. These are easier changes that allow people to maintain their personal savings rates, an important factor to keep in mind when many have had recent changes in employment/income. 

Consumers can aid in the empowerment of minority-owned businesses, but I believe more formal investment vehicles are a faster method for change. SoftBank stepped up and created a $100m fund called the Opportunity fund, which will only invest in minority-owned companies. It is amazing that they put this together so quickly, and it will make a difference, but $100m seems like a drop in the bucket of systemic racism. The minimum investment from their (largely laughable) Vision fund was $100m, and the size of that fund is $100bn. Funding is a barrier that is often difficult for minority founders to access, and this fund will hopefully have amazing ripple effects across the industry. 

Another important industry to look at is personal security/defense. These have already been extenuated by COVID, but civil unrest and talks of defunding police will heighten the importance of security more than ever. Firearm and ammunition sales have increased since the start of the outbreak, with gun sales increasing by 85% YOY in March and 71% YOY in April. Home security system sales also have increased significantly. Both of these markets should continue to gain steam as sentiment and legislation moves forward about defunding the police. An interesting distinction between the guns/ammo market and the security system market is the finite nature of guns/ammo. Once a few weapons are owned in one household, the majority of people do not need to purchase more. These people are buying for defense reasons, and do not need a large amount or variety to feel secure. Those who are connoisseurs of weapons for sport will not be affected by COVID or worries of civil unrest, and will consume as usual (barring slightly different behavior from income changes). Ammunition is a small recurring expense, but most who own firearms for defense reasons are not at the range burning through boxes of ammo on a weekly basis. 

Security systems, on the other hand, operate more as SaaS companies. Many have little to no installation costs and offer subscription pricing models, which provides recurring revenue. To remain protected, people must remain subscribed, especially after a system is installed. The hardware involved makes switching costs high, so it is unlikely that consumers will switch security companies. Hence, the battle for new consumers will be crucial to revenue growth. It is a real pain to have old systems removed and new systems installed to save cents on the dollar, especially when you are a boomer who has to figure out how to work these systems. This is much different than switching between Zoom/MSFT Teams/WebEx for cost reasons, showing how unique the security market is within the broader SaaS scene. I also hope that the investing scene can fuel developments in public security, especially the use of AI and pattern recognition to remove racism and police discretion from the streets. The low cost of borrowing and large amounts of dry powder that investment vehicles have saved up can be put to good use. 

The third important category — when we rebound fully — whenever that may be. Nobody knows. Stocks will go up. There is talk that the market is overvalued at the moment, as evidenced by the increase of recreational trading and various valuation metrics. Stocks are somewhat close to pre-COVID levels, so I do not understand where they will go once earrings rebound to pre-COVID levels. If share prices were to grow proportionally to their increases in earnings/revenue during the rebound, we will essentially have increased the Y-Intercept by 7-9%. I think a bubble has to burst somewhere, as so many people bought into the equity markets based on the principle that stocks will continue to go up. I do not see how expected downfalls can be priced into the market. But we will see. If I was to boil my rebound results into one sentence: There will be a bubble somewhere, but stocks will still go up before/after the market gets a quick reset to their actual performance, in the long run.

Sincerely, 

Litquidity Capital


The Streaming Decade

By Michael Medvedev

—

First of all, thank you for taking the time to read Williams Insight. I am hoping that this article will give you a nice break and move your focus away from COVID-19 and the world economic crisis. As we have all been home for the past month, adjusting to our new ways of life, watching Tiger King and Love is Blind, solely relying on pushups, squats, and daily bike rides to stay lively, I took it upon myself to research an up and coming, ever popularizing, streaming device called “Roku.” 

What is Roku?

Roku is the 2nd best-seller on Amazon in the electronics category (below the Amazon streaming Fire stick, unsurprisingly) and has been making a lot of noise in the video streaming world in the past two years. The California-based company started as a unit of Netflix, making the company’s first set-top box. In late 2007, once Netflix adopted a hardware-agnostic strategy, it divested its Roku business. 

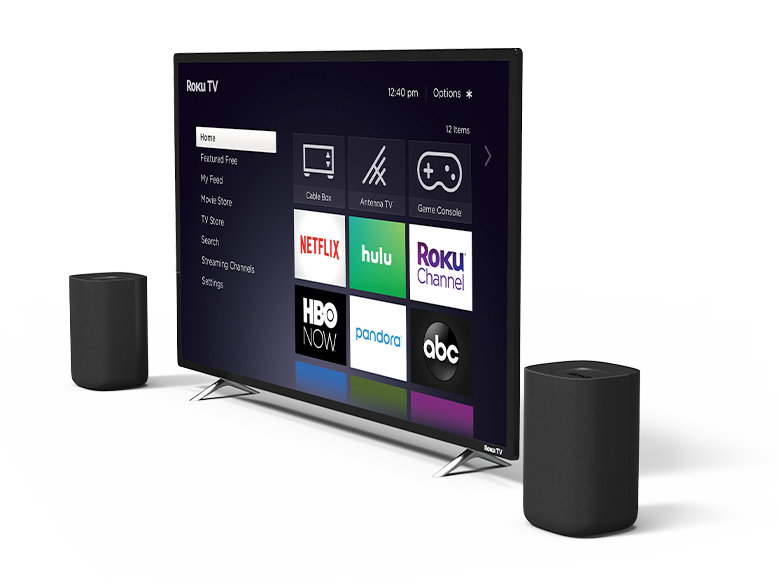
Simply put, Roku allows you to watch video content on your TV via the internet. Think Netflix, Amazon, Hulu, Sling TV (if you watch that), Youtube, other video streaming services, hundreds of TV shows and movies all in one place, on one TV — no subscription fee required. In addition to paid-content options, there are dozens of free sources (ex. Youtube, The Roku Channel, and of course the good ol’ web browser). Besides being a single streaming platform, Roku is easy to set-up with user-friendly buttons, graphics, search engines, has a variety of channels (American and International) as well as games, media libraries, and security cameras in addition to streaming. Essentially, Roku combines the best of cable with streaming platform offerings, making it a destination for all entertainment content. Sign me up!

Roku devices can be connected to any TV with HDMI connection and start at $30, going up to $100 for higher-end models. Company revenue stream comes not only from device sales, but also from software licensing to third-party companies, mostly to TV manufacturers such as TCL, RCA, Toshiba, and Hisense. In fact, in the first 9 months of 2019, 1 in 3 smart TVs sold in the US came with Roku OS. During 2019, the company’s  fastest-growing source of new accounts was licensing arrangements and relationships with brand partners and service operators, which collectively accounted for 56% of new accounts, up from 50% in 2018.

Management team

Roku’s management is solid and experienced. Anthony Wood, Roku’s founder, chairman, and CEO is a video industry veteran, known as the man who invented the first DVR. He founded Roku in 2002 and has been its CEO since. His leadership team consists of seasoned industry executives, with Scott Rosenberg (Senior VP) and Matthew Anderson (CMO) both having extensive entrepreneurial experiences and passion for the video streaming industry. 

Revenue

Roku has 3 main streams of revenue:

  1. Direct Sales of Hardware and Accessories to distributors, retailers, and DTC, accounting for 37% of net revenue last quarter.
  2. Licencing OS to TV manufacturers allowing them to offer Smart TV with content at competitive price points. 
  3. Ad-supported Video on Demand (AVOD) – the main revenue driver for the company.
    1. Roku’s recent acquisition of Dataxu will make it easier for mid-sized advertisers to buy ads on Roku TV platform and serve a wide array of advertisers. 

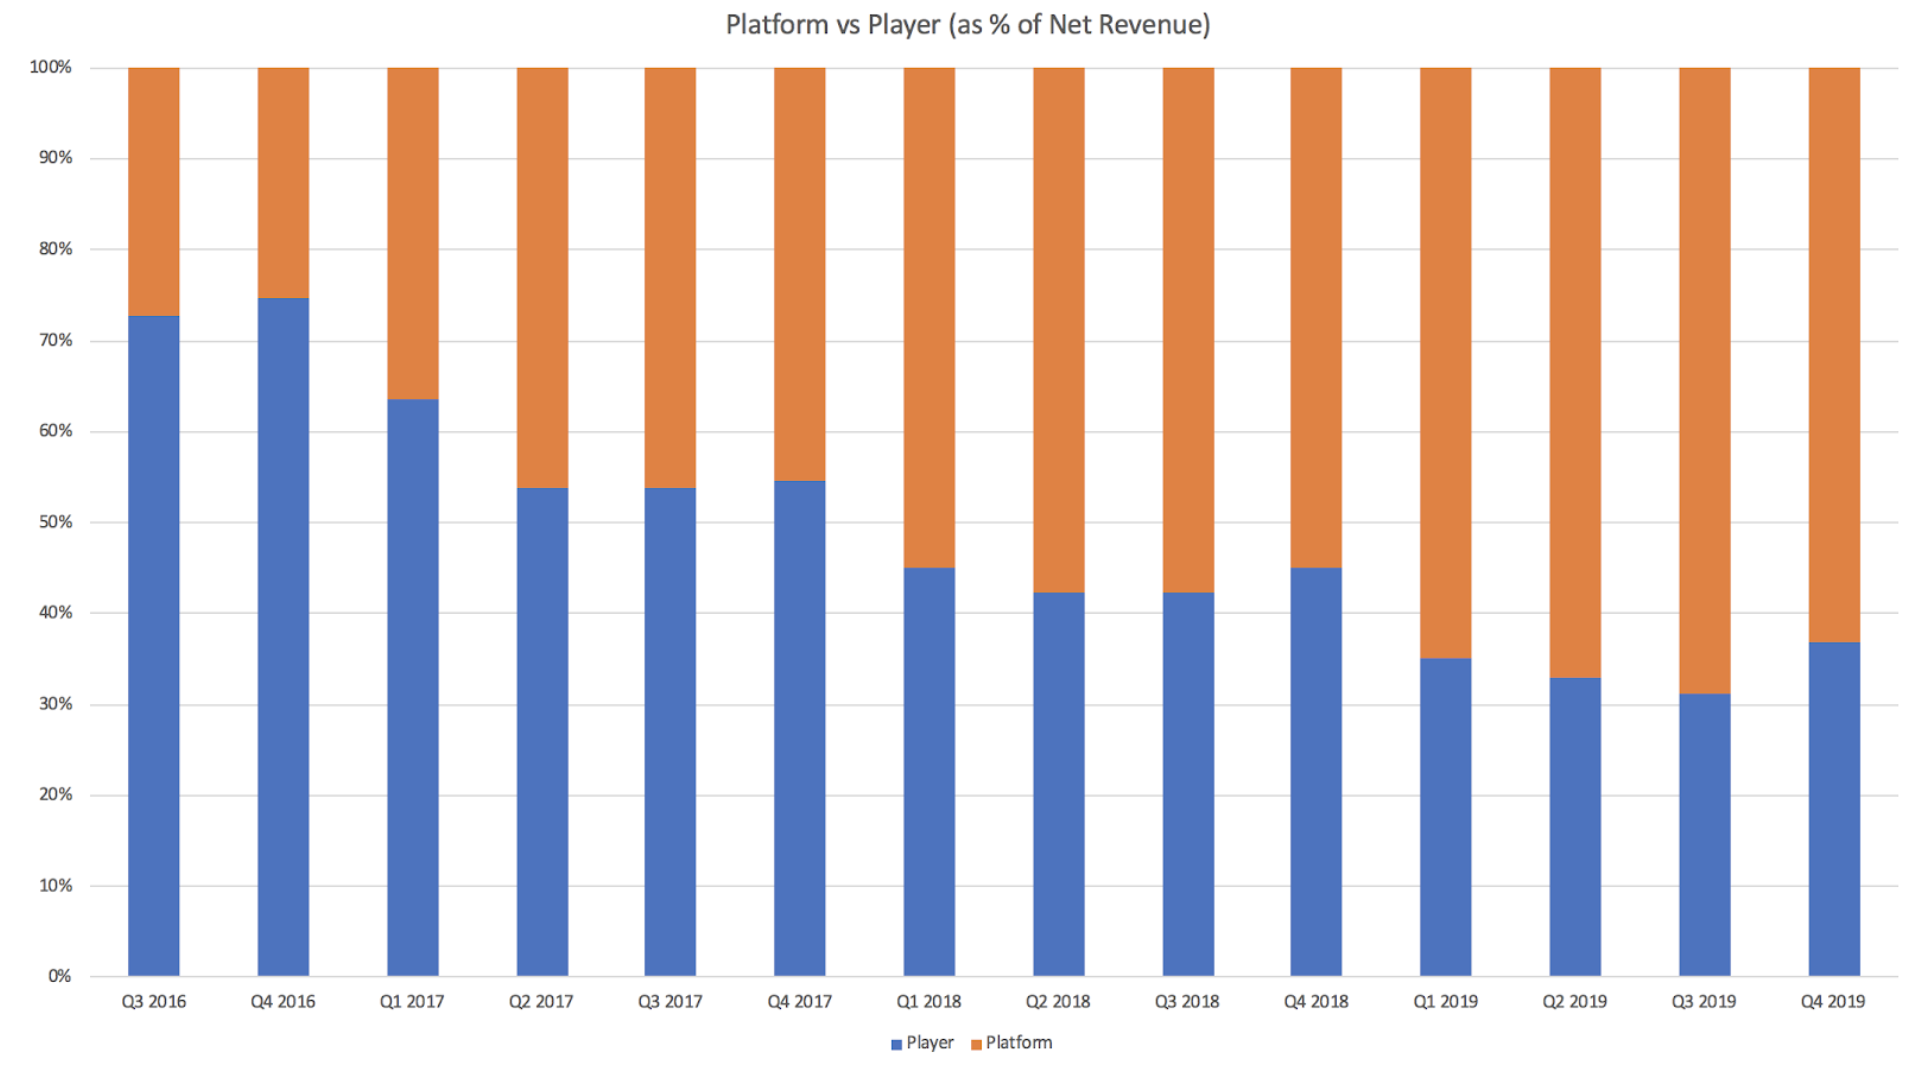
Roku generated $1.13 billion in revenue in 2019, a 52% increase from 2018. Roku’s gross profit was $495.2 million in 2019, a 49% increase from 2018. The company projects $1.6 billion in revenue by the end of 2020. From the above streams, the first category is listed as revenue from “player,” and the bottom two are listed as revenue from Roku’s “platform.” Having originally focused on player revenues and profit, Roku is now selling its hardware at cost (i.e. with 0% gross margin) and using its hardware as a vehicle to boost revenues through its platform. 

One of the key offerings from Roku is The Roku Channel:  a free channel offering hundreds of free TV shows and movies. Roku sells a wide range of ad inventory offerings inviting users to engage with brands. The Roku Channel has become a leading source of advertising inventory, and is an integral piece of Roku’s strategy to grow platform revenue and improve profit margins. The company reportedly commands $30 per 1,000 impressions, which is one of the highest rates in the media industry. To further drive user engagement, Roku also recently launched Premium Subscriptions that give users the option to access ad-free premium content from many streaming service providers. Lastly, Roku takes a cut if a user signs up for Netflix or any other streaming service through a Roku device, allowing them to profit from rival streaming services. Cha-ching!  

International Expansion Opportunity

Roku’s revenue is highly concentrated in the United States, with 90% of its net revenue being domestic. In 2020, Roku is ready to capitalize on the international retail distribution, content, and manufacturing relationships it started building in 2019. Its first big expansion was in Brazil in January of this year. The company announced partnerships with AOC and Globoplay for new smart TVs, and will be bringing a lineup of streaming channels, movies, TV series, as well as Roku players to the country. Just this month, Roku announced it is making another big investment in Europe, by expanding The Roku Channel to the U.K. Roku is also increasing its market share in Mexico and Canada. 

Compared to 39% market share in the US, Roku has only begun to enter the international arena. The global smart TV market size reached $183.6 billion in 2019 (119 million units) and is expected to grow to $292.55 billion by 2025 (293 million units) at a CAGR of 9.5% — another industry tailwind. 

Great user monetization

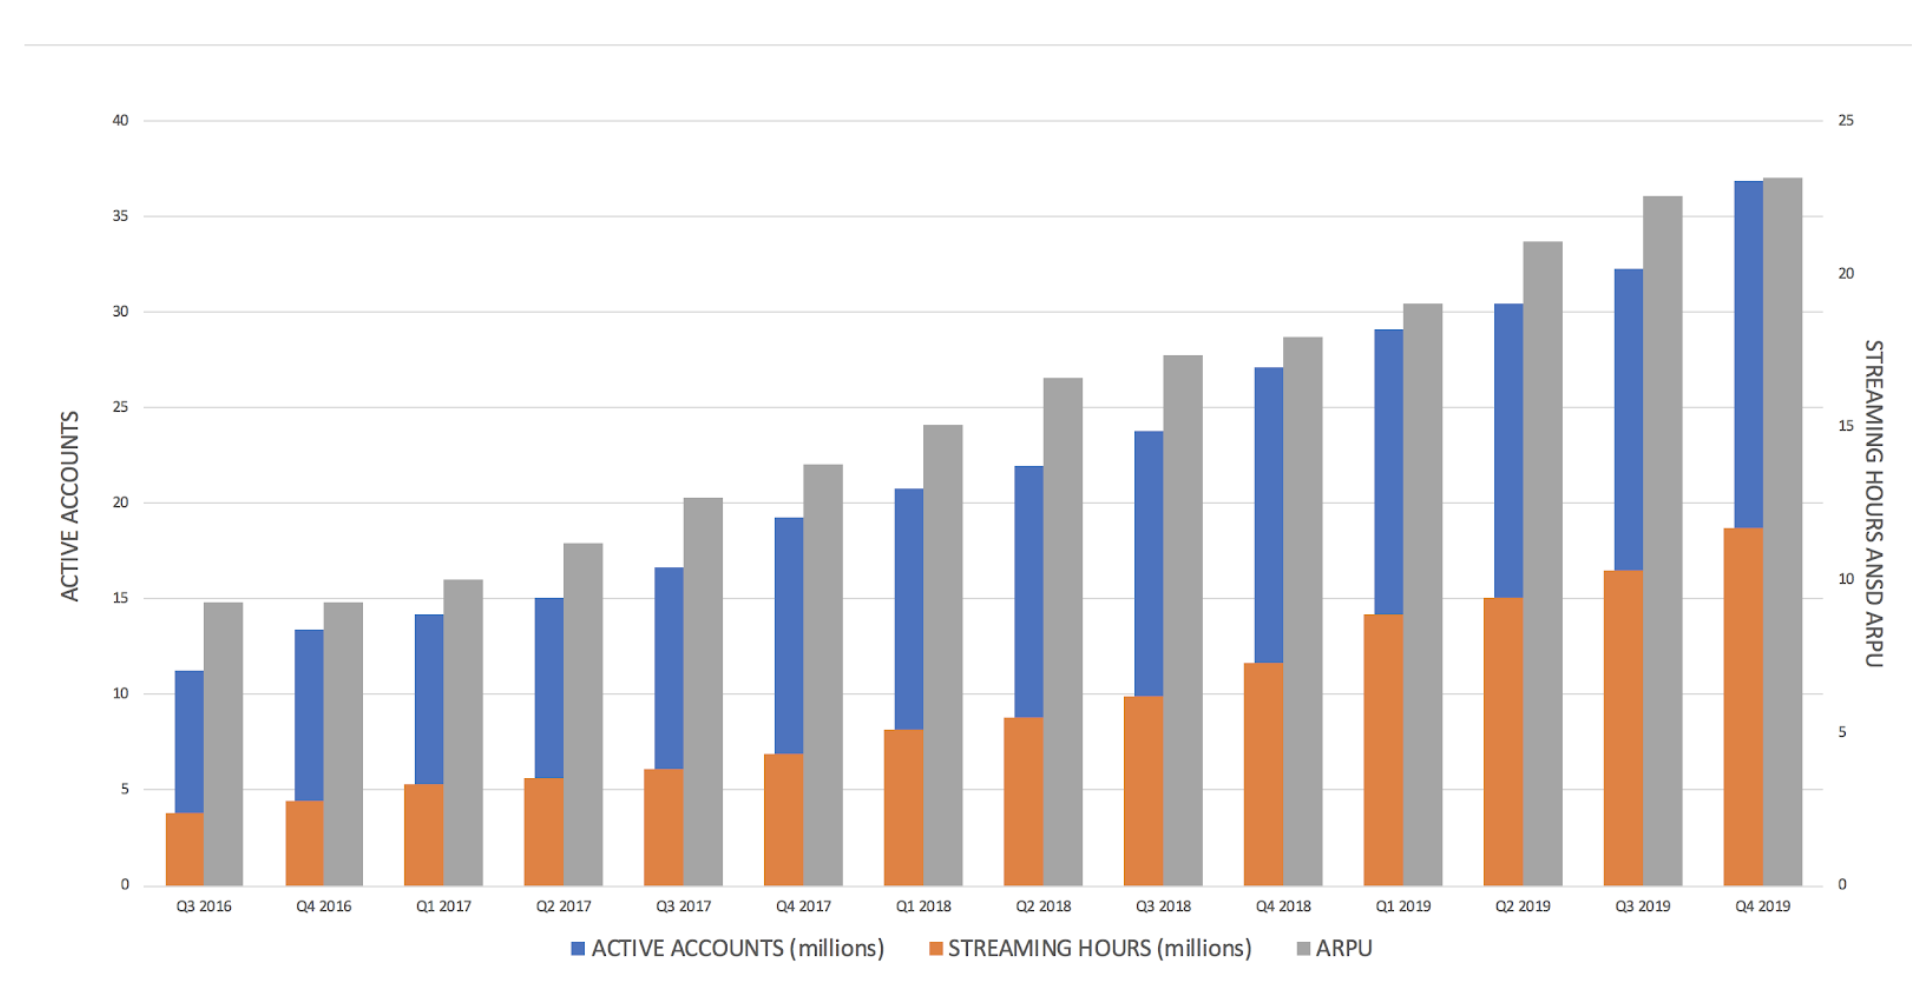
Roku tracks 4 key metrics to assess its business model: revenue, active accounts, streaming hours, and ARPU. The number of active accounts, or active monthly users, has been increasing tremendously. Roku’s user base expanded 36% in 2019, adding a record 4.6 million active accounts in its last quarter, closing out the year with 36.9 million active accounts. 11.7 billion hours of content streamed through Roku’s platform in its latest quarter is up 60% year-over-year. This determines Roku’s advertising inventory and sell-through rates. And lastly, ARPU was $23.14 over the trailing 12 months, a 26% increase from 2018. Roku can increase both the value and the number of its customers.

Another industry tailwind —  it is estimated that 56 million households will have canceled cable or satellite TV subscriptions by 2023, a 14 million household increase from today. We expect to see the number of active users and ARPU increase dramatically as more people move towards streaming in the decade ahead. 

Great growth financials

It is also important to mention that Roku has changed its focus from set-top boxes to media software, which produces wider profit margins for the company, expanding future equity multiples. This year, sales from the platform unit surged 86%, compared to a 24% increase from the player side of business last year. Roku says they are no longer focusing on sales from its players segment, but rather working to maximize account growth and ad sales. “Player revenue and player gross profit may decrease over time as we strategically aim to acquire new users through the sale of lower priced streaming players.” – Roku 2020 10-K. We expect that the tradeoff from player gross profit to grow active accounts will result in increased platform monetization and gross profit.

Roku also has a healthy amount of cash. As of December 31, 2019, it had $515.5 million in cash and cash equivalents, a 233% increase year-over-year. Roku believes that its existing cash balances and cash flow from operations will be sufficient to fund its working capital and meet anticipated cash needs for the foreseeable future.

Risks and Competitors

The TV and video streaming industry is larger than ever and continues to grow. Roku is still a $10 billion company disrupting a $140 billion linear TV advertising industry with strong gross margins. 

Roku’s primary competitors are Amazon’s Fire Stick and Apple TV. Roku stands out and has proven to be the leader in the industry in a number of ways.

    1. Amazon’s streaming product is currently in 180 more countries than Roku (200 vs. 20), but both companies have similar numbers of active accounts. This gives Roku great international growth opportunities.
    2. Roku’s advertising platform model is unique. While Roku has stepped back from its focus on player deliveries, and as more people become attracted to Smart TVs, Roku will continue to generate ad revenue from an increasing customer base.
    3. Roku’s options of free media are major reasons as to why customers are attracted to Roku as opposed to its competitors. Roku has become one of the most economical ways to stream video. 
    4. Comparing market share, Roku dominates market share for streaming media platforms. Roku has about 39% market share, ahead of Amazon’s 30% share from Fire TV and 16% from Apple TV. In the dollar share for ad revenue, Roku stands at 59% Amazon at 19%.

It would not be an investment article published in April of 2020 without the mention of COVID-19. Of course, estimates this year could change because of the uncertainty of the impact of COVID-19. The good news, however, is that consumers are limited to what they can and can not do while they are stuck at home and, fortunately, streaming TV shows and movies are among the activities that are available. We believe the COVID-19 situation may not have a significant negative impact on Roku’s revenue. In fact, we believe COVID-19 will ironically be a positive for the company and its stock as more people are staying home, generating revenue for Roku. We expect Roku to see an increase in streaming in Q1 and Q2 of 2020 as a result of COVID-19. We have seen an influx of users and downloads over the past 3 months adopting Netflix and we believe this surge will translate into Roku’s streaming hours. As of March 17, data shows that Netflix downloads in Hong Kong have doubled since January 1, while in South Korea they have risen by 33%. Similarly, Netflix downloads are currently up 100% in Italy and 50% in Spain, compared to early February.

Lastly, there is a common misconception that the introduction of new streaming services (i.e Disney + and Peacock) negatively affects Roku’s growth. In reality, While streaming services are producing more content, Roku is also thriving by streaming that content across Roku TVs. More competition and content creation within the streaming services sphere is critical to their own growth. Plus, Roku makes money from subscriptions bought via its software as well as through ads shown on its platform. Along with licensing its operating system to TV producers, Roku’s business model protects it (at least partially) from risks associated with stream-only competitors. 

Business to Stock

Taking a look at Roku’s stock, there is no hiding from the fact that it trades at high multiples. With a price to sales of around 9.4 and negative earnings, there is definitely reason for an investor to look away at first glance. However, after learning about Roku’s business model, its year-over-year growth, and the aforementioned catalysts, the valuation becomes more attractive.

Profitability is on the way as Roku increases its gross margin. Gross profit margin increased to 44% in 2019, up from around 30% a couple of years prior. As gross profit margin will continue to increase with software sales, this will allow the company to reach its projected positive earnings around 2022. Roku is still reporting an adjusted loss and is focusing on growth and innovation. 

Valuation – with Insight Contributor Shayan Moazeni

We decided to project Roku’s revenues for the next 8 quarters. We believe that Roku will continue to successfully launch new licensing deals with key manufacturers these next two years. Along with their plans for international expansion and a projected increase in sales as a response of COVID-19, we are very optimistic with Roku’s account, revenue, and earnings growth.  

Firstly, Roku has publicly said that they will no longer be focusing on profitability from their player segment. Roku has also been spending a lot of money on Marketing and R&D the past several years. However, we believe these costs will stay the same, if not increase at a decreasing rate. Similarly, G&A has historically been increasing and will continue to increase as Roku grows.

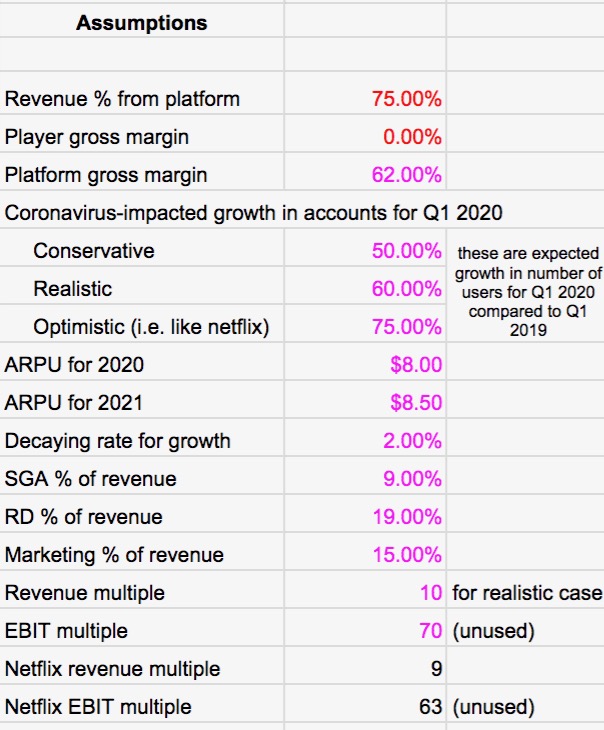
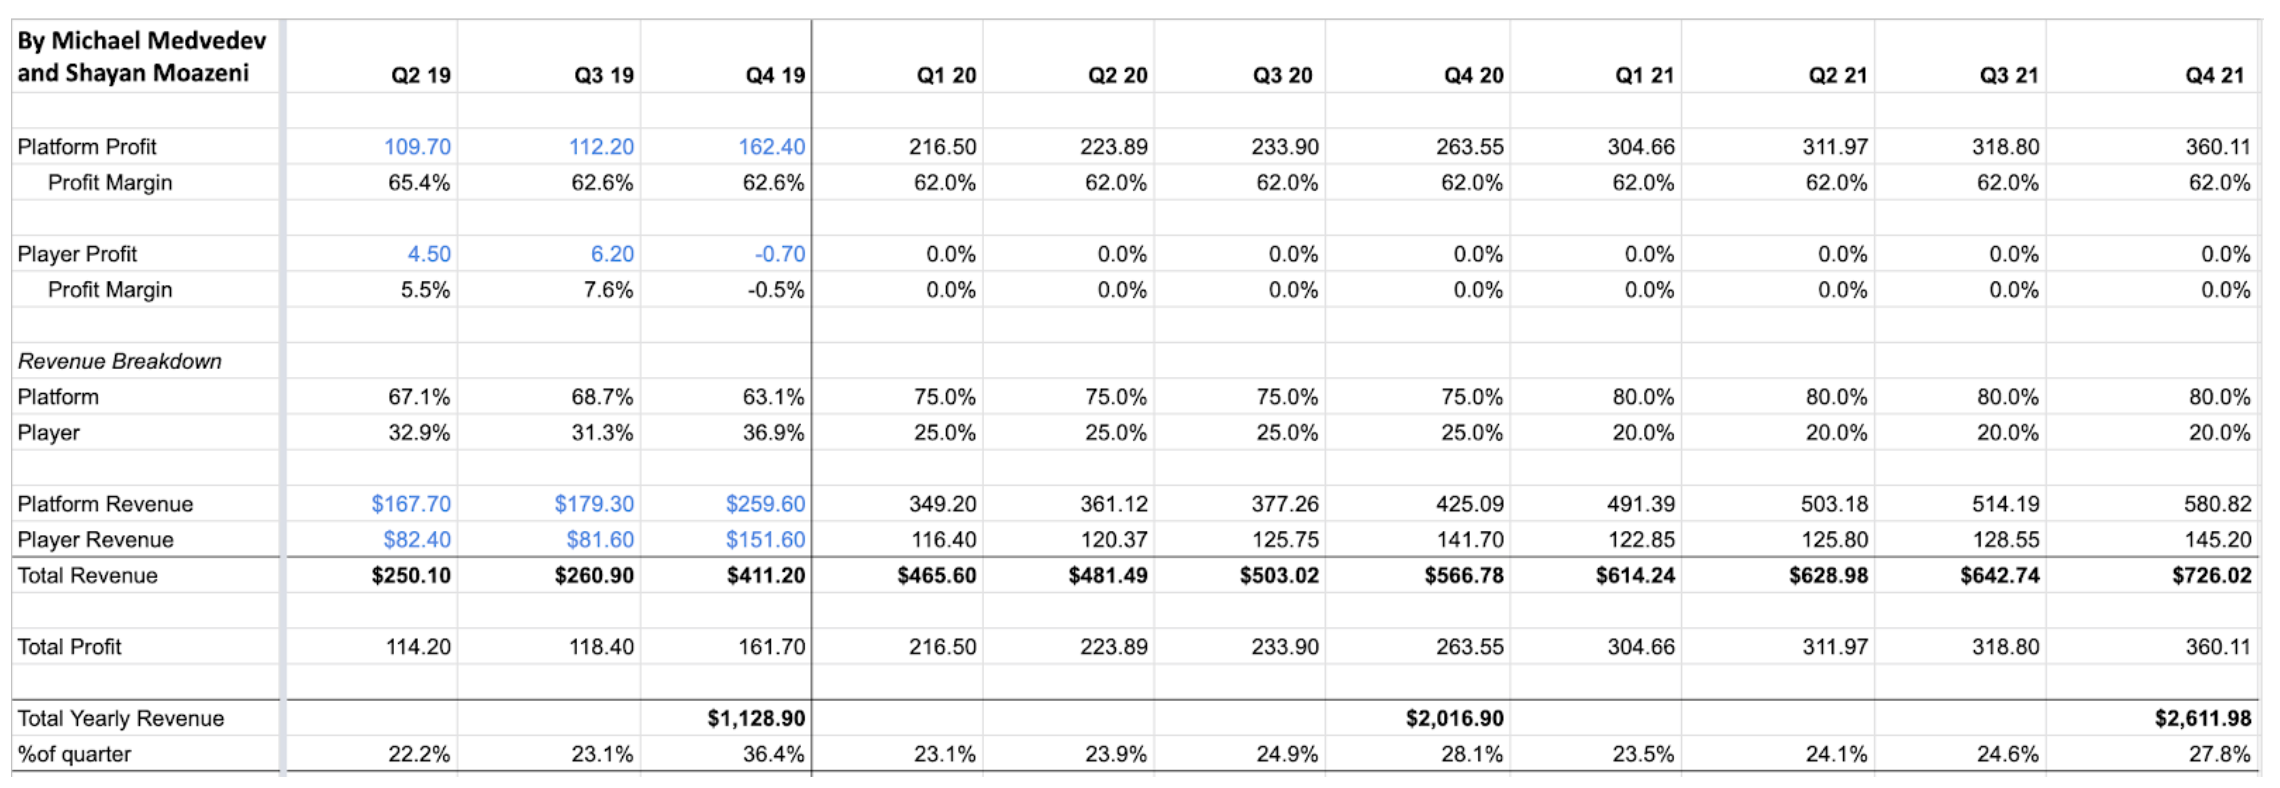
We projected that the profit margin from Roku’s platform segment would maintain around 62%, which it has historically. This margin is very conservative, as scaling up through expanding into new international markets can certainly increase profit margins. Roku expects around 75% of its annual revenue this year to come through its platform and 25% through its player revenues. Having started at 75% hardware revenues, we believe this trend will continue into 2021 and at least 80% of revenues will come from Roku’s platform. By projecting platform revenues, then, we can estimate total quarterly revenues for the next 8 quarters. 

Taking a look at Netflix Q1 earnings, Netflix doubled their expectations of new subscribers due to COVID-19. We believe this will have a similar impact on Roku’s sales and account growth as well. While an equally impressive additional growth would be highly optimistic, even a much more moderate growth–as used in our realistic and conservative estimates–can have a substantial impact on Roku’s performance this year.

Roku was projecting $1.6B in revenue by the end of 2020, pre-COVID-19. However after considering the impact that COVID-19 has had on consumer tastes, we are now expecting a revenue of close to $2B in the conservative case. We projected Roku’s platform revenue by taking a look at their past quarterly account growth and projecting their account growth, as well as adding a decay rate in three Post-covid cases: conservative, realistic, and optimistic.  

Netflix is trading at 9x market cap/revenue multiple. Roku currently trades at a 13x multiple and has traded as high as 16x in the past year–clearly optimistically valued. For our conservative estimate, given our high projections of revenue growth, we assumed this multiple can drop to as low as 7x; this multiple would make the current market valuation exactly efficient by the end of this year. For our realistic valuation, we assumed 10x, given Roku’s smaller size and more room for growth internationally compared to Netflix. For our optimistic approach, we stuck to the current 13x, providing the highest returns. 

One very impressive source of growth for Roku has been revenue earned per user. As recently as the beginning of 2017, Roku was only earning around $3 per active user, a figure that has sky-rocketed to $7 now thanks to better advertising and efficiency. We expect this trend to continue and assume an ARPU of $8 in 2020 and $8.5 in 2021. 

Projecting the growth in new active subscribers this year, using the ARPU, we projected platform revenues for the next 8 quarters as follows. Employing the aforementioned revenue breakdown, we calculated total revenues and expect Roku to be profitable this year–while turning a profit this quarter might be overly optimistic (as the attached model suggests), we believe turning a profit for the entire year is more than reasonable. 

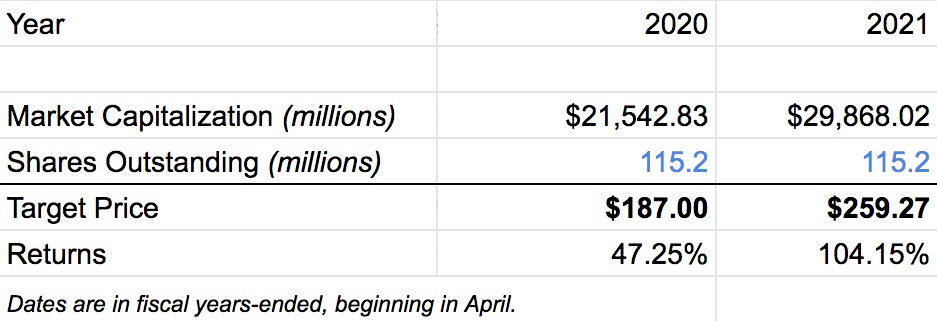
This yields our final, realistic valuation of Roku for the next two years. 

To take a full look at our model and assumptions, as well as our conservative and optimistic valuations, please click here. Our model also predicts gross profit and EBIT, but those projections were not taken into account for our valuation.

Conclusion

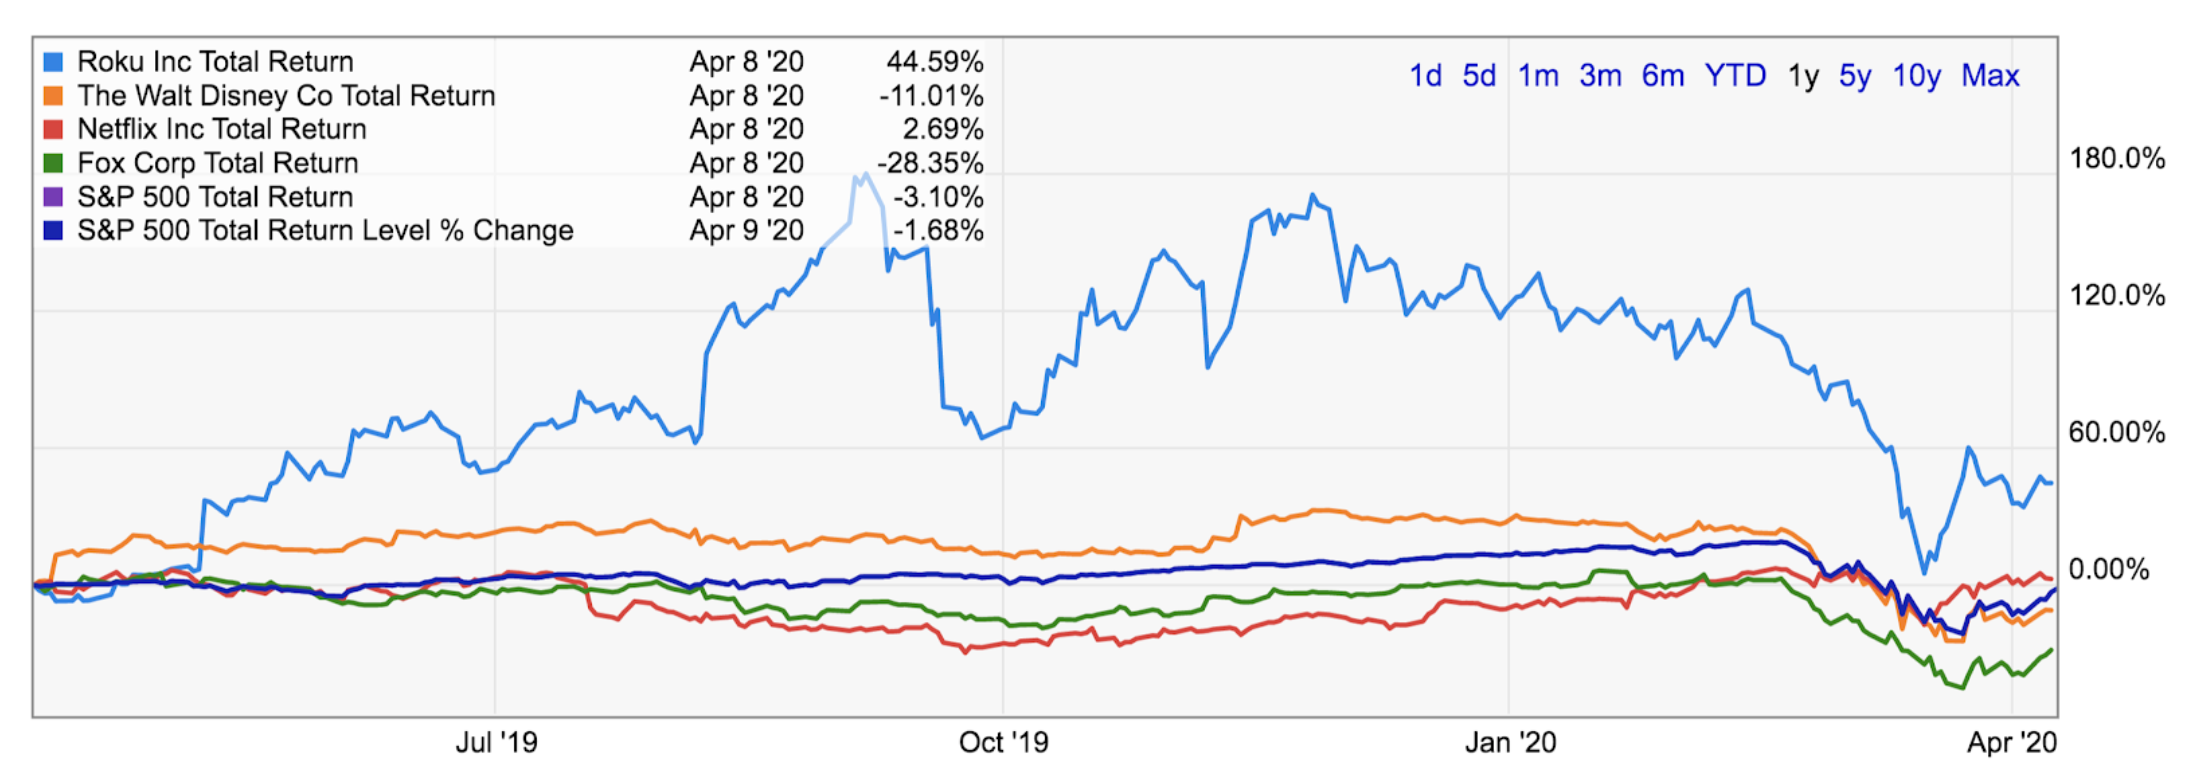
Let’s begin to wrap it up. With Roku having a heck of a 2019 year (business and market price wise – stock price quadrupling in one year), the start of 2020 has been pretty rough, as with almost everything else (unless you have been living under a rock). Roku’s shares have been cut nearly in half since peaking a little more than six months ago. 

However, we know that Roku is a high-growth stock that has been focusing on expansion. We know that Roku’s international expansion has huge growth potential. Even with negative earnings now, in the long run, with little debt, strong cash flows, strong positive financial outlooks and estimates, a great AVOD business model, increasing player platform profit margins, and in an era where cord cutting is at a record pace, the wind is at its back. Our recommendation is: 1) buy for the long-term and 2) might as well buy a Roku.     

Livent Corporation Equity Research

By Stephen Kletscher


Summary

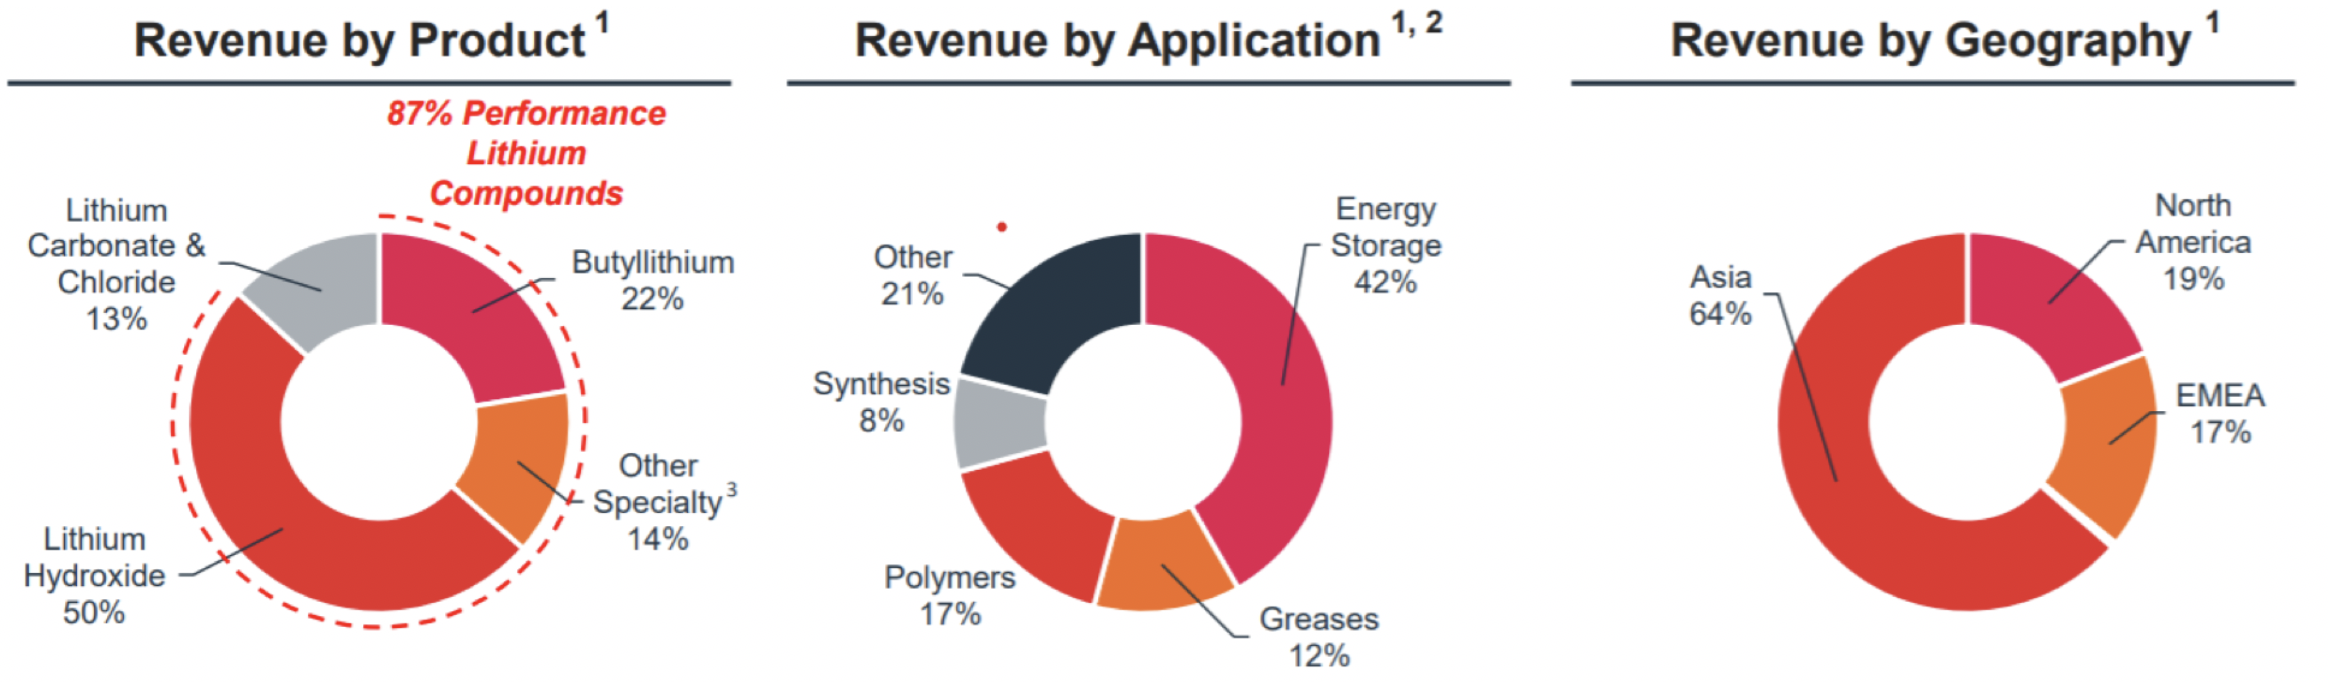
Livent is a lithium producer headquartered in the United States with production facilities in Argentina. Livent both extracts raw lithium materials and manufactures lithium compounds with over 60 years of experience in lithium compound production. It produces and distributes applications in batteries, agro-chemicals, greases, polymers, and various industrial applications. Livent has high revenue exposure to Asia (64%) with smaller exposure to North America (19%) and EMEA (17%). On October 12th of 2018, Livent Corporation spun-off of its parent company FMC Corporation, an S&P 500 component company. Livent generates $388 million in revenue and has a market capitalization of approximately $724 million, making it the largest pure play lithium producer in the United States.

Competitors: SQM, Albemarle

Investment Thesis

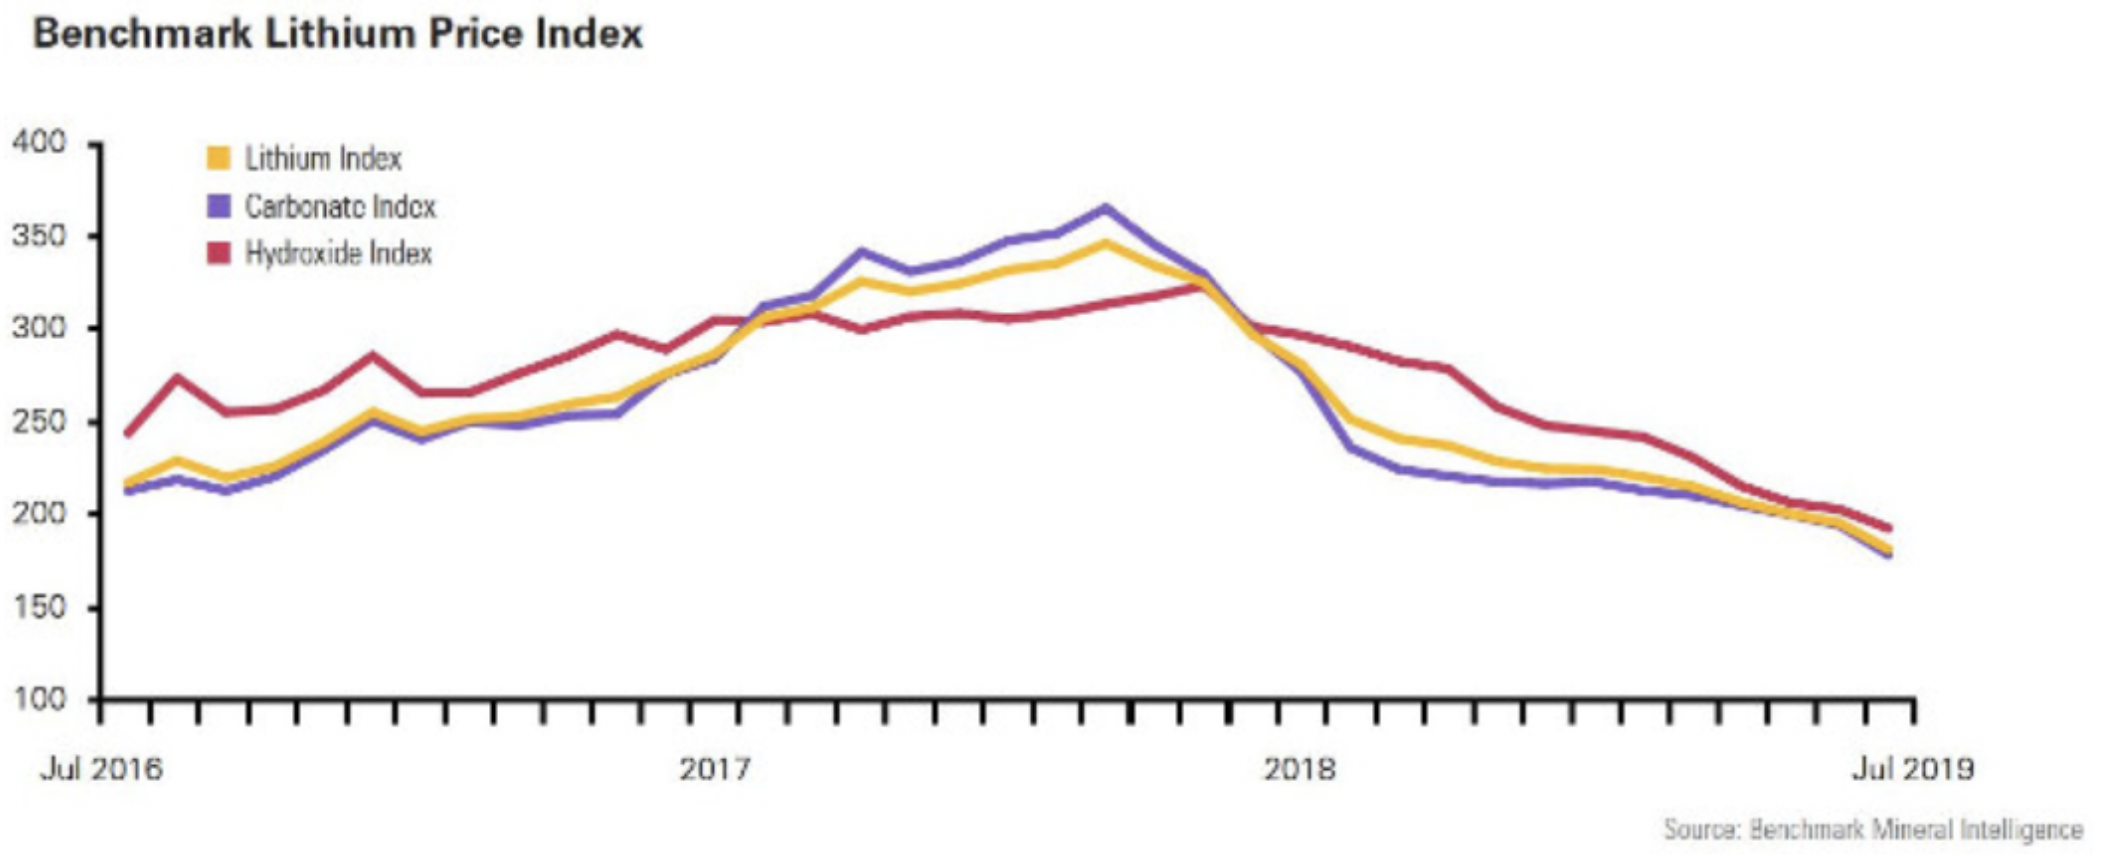
As of March 22nd 2020, Livent Corporation is trading at a cost of $4.95 per share. The price has declined 61.69% in the last year. Livent has a cheap valuation due to recent hard times in the lithium industry. It currently has an EV/EBITDA of 9.38, which is lower than slower-growth competitors SQM (14.66) and ALB (10.09). Sentiment towards future lithium production has grown negative over the past few months due to concerns about oversupply. Many of the major producers of lithium are ramping up supply to meet anticipated demand. Still, there is not enough investment in the space to keep up with long-term demand. Demand is expected to outpace supply by the end of 2021, which should increase prices or keep them stable. Livent can then drive continued EBITDA growth purely through volume.

Livent has a very advantageous market position. It is the lowest cost producer of both lithium carbonate and hydroxide. Livent extracts lithium compounds from its brine operations in Salar del Hombre Muerto in Argentina. Brine extraction for lithium compounds is much less costly than extraction from hard rock such as other producers use. Most new production sites from other companies are hard rock extraction sites, which are significantly more costly. Livent is the lowest cost lithium producer on the market with an EBITDA margin of 20.62%.

Livent has a moat in that it is difficult for new companies to enter the lithium business. It takes an enormous amount of investment to mine a new location. The technology to produce lithium is costly and complex with long time horizons to establish expertise in producing compounds and developing customer relationships. Livent has been in the lithium production business for over 60 years and generates more than 60% of its revenue from customers it has had relationships with for over 2 years.

Livent also has the advantage of a truly global footprint with 7 manufacturing sites across 4 continents. It is one of two companies to produce lithium hydroxide in multiple countries. Lithium hydroxide is used in the production of electric vehicles, so spreading out production in multiple countries helps Livent capture a high future growth area for lithium products. Because Livent already has manufacturing facilities in place across multiple countries, it has an advantage in providing supply as manufacturing capacity catches up with demand. Livent is the only producer of high purity lithium metal in the Western Hemisphere. Because high purity lithium metal is often used US military applications, Livent has an advantageous position in obtaining lucrative government military contracts.

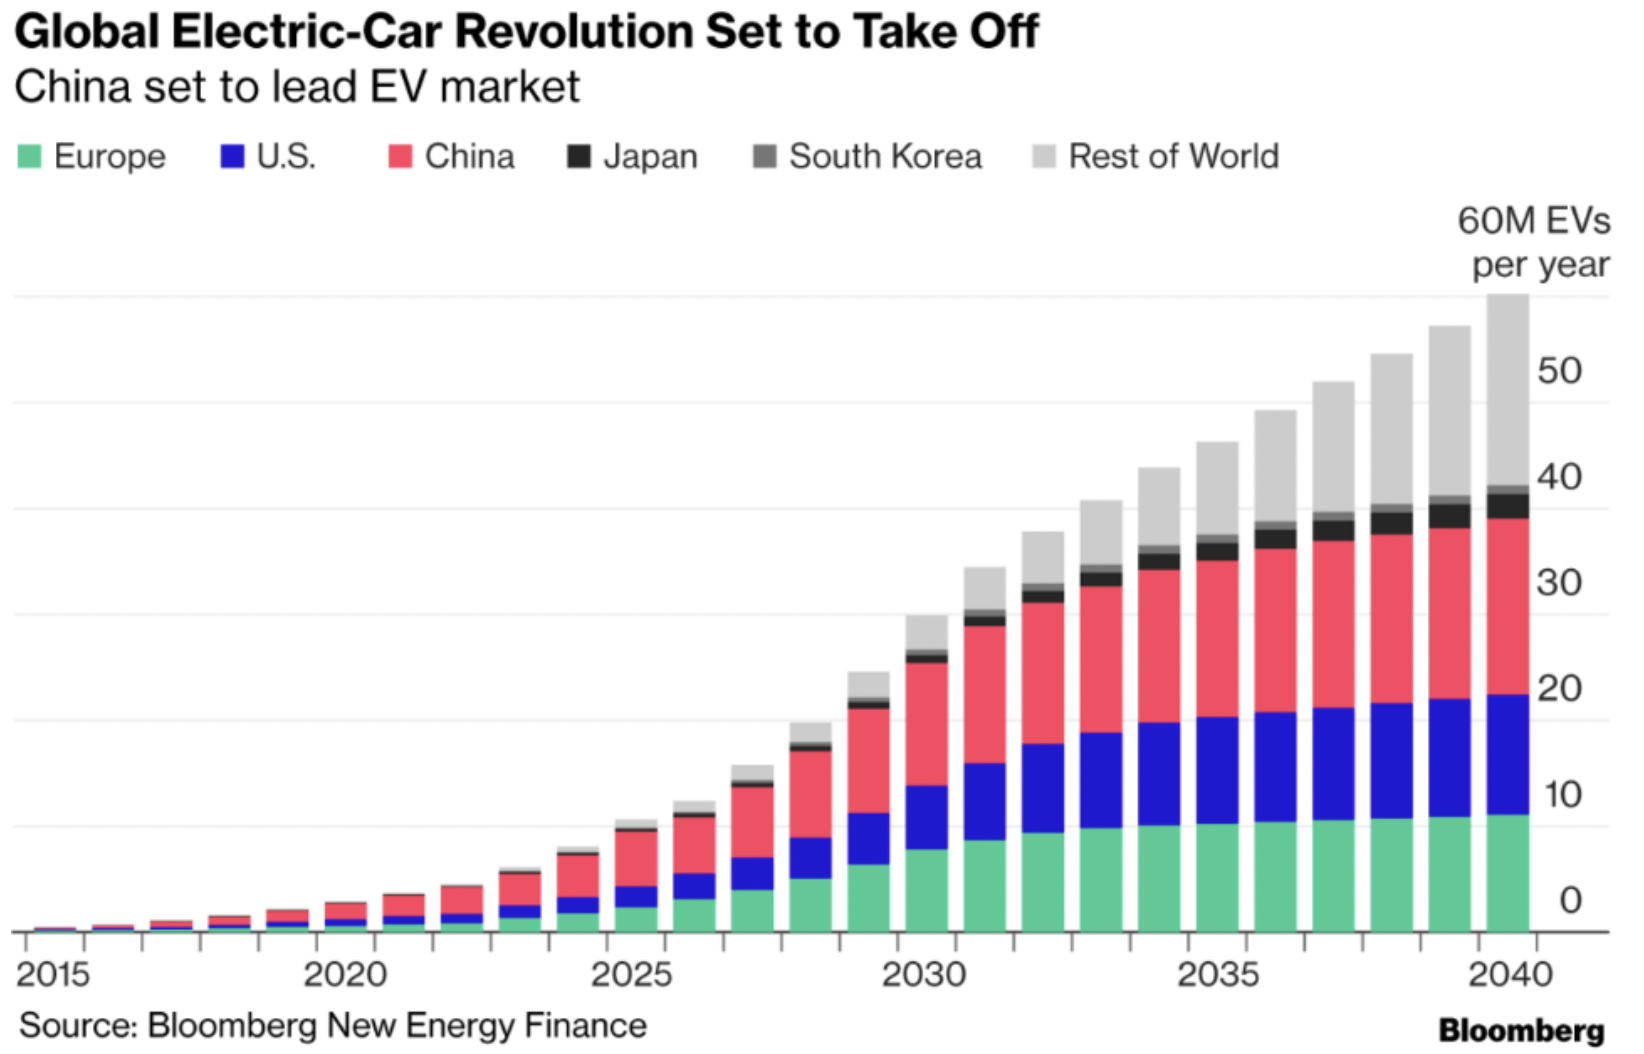
Lithium demand is expected to increase exponentially in the next 10 years. Because lithium is used in electric vehicle batteries, demand for lithium will soar as electric vehicles become more popular. Livent is one of a small number of major suppliers of lithium hydroxide for EV applications. It is focusing on building relationships across the EV supply chain to obtain maximum market share. Sales of electric vehicles are expected to skyrocket in the next ten years, particularly with electric vehicle subsidies in Asian nations. Asia accounts for 64% of Livent’s revenue, so it is a very important market to have these kinds of subsidies for. EV sales are projected to grow at a 32% CAGR through 2027, reaching 19.6 million vehicles in annual sales volume. Due in large part to increased electric vehicle production, Lithium has an expected CAGR of 22% from 2020-2025. Increased production of electric vehicles will result in a large increase in lithium demand that Livent is well positioned to supply.

Livent has plans to heavily increase production in the future. It plans to triple production by 2025 through continued development at the low-cost Argentina site. It is also exploring acquiring a new site to help meet future consumer demand. Increased production will improve profit margins as Livent has had to acquire third party lithium supply to meet customer demand for lithium compounds. Livent plans to use operating cash flow to fund organic growth without relying on global credit markets. This will allow Livent to maintain a strong balance sheet, which is particularly important for a company with high exposure to volatile commodity prices.  With plans to grow using operating cash flow, Livent should also continue to reduce debt in the future.

However, Livent is well positioned to succeed in any lithium market conditions as it has a stronger balance sheet and lower costs than its competitors. Furthermore, it takes time to develop the manufacturing facilities and build a supply chain with manufacturers of electric vehicles. Livent already has these facilities in place and is a market leader in R&D for high-quality lithium’s uses in batteries.

Investment Risks

Livent is entirely dependent on the price of lithium. Because it is a pure-play lithium producer, it does not have any other businesses to fall back on if lithium demand decreases. EBITA varies wildly depending on production and lithium prices with EBITDA of $171 million in 2018 and $80 in 2019. Commodity prices tend to be much more volatile than stocks, so having high exposure to commodities results in a more volatile business.

Growth in demand for lithium is dependent on increased sales of electric vehicles. EV’s are currently subsidized by Asian governments such as China. China recently reduced its EV subsidies and may continue to do so in the future. Several major customers are delaying new launches of EV’s due to economic uncertainty in China. If a major economic downturn occurs, the rollout of new EV’s will be delayed. Current macroeconomic conditions are poor with the spread of COVID-19. This could impact the demand for lithium, particularly as supply increases in the market.

There is additional risk associated with Livent’s facilities in Argentina. Livent obtains the majority of its product from its operations in Argentina. This exposes it to political and operational risks associated with Argentina in general. Additionally, Livent’s production can be affected by weather. In the beginning of 2019, late rains delayed lithium carbonate production for 3 weeks. The unpredictability of weather causes this investment to be even riskier.

Recommendation

My overall recommendation is to buy Livent Corporation. In the long-term, this company is a very solid buy. Its strong balance sheet and advantageous market positioning should position it well for the future. Additionally, the outlook for lithium demand is very positive in the long term. Livent’s low cost of production and high profit margins combined with its position in an industry growing at a CAGR of 22% make it a profitable growth stock. Recent selling pressure has created a very attractive value play with high growth opportunities.  Once the current selling pressure from an unfavorable macro environment has passed, LTHM will begin to trade more like a growth than value stock.

Smile Direct Club: Cheap Grins, Cheaper Stock [Sold]

By David Shakirov

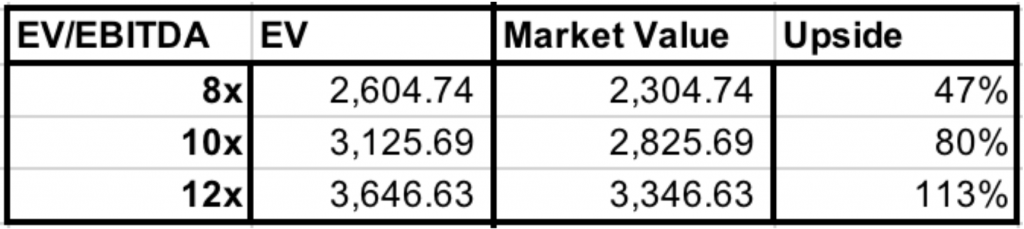
UPDATE (03/26/2020): After a smashingly lucrative three day run (a 50% GAIN), the author recommends selling SDC stock. Though long term fundamentals are strong, the stock’s takeoff of 50% since the recommendation places it ABOVE the 8x EV/EBITDA target of 2025. At this valuation, the risk return profile on the company is unattractive. Here is an updated projected returns chart from the stock price as of this writing ($6.37). I recommend booking these gains of 49.5%, or 39% above the S&P 500, now.

\\\———————————————————————————————————————————///

ARTICLE:

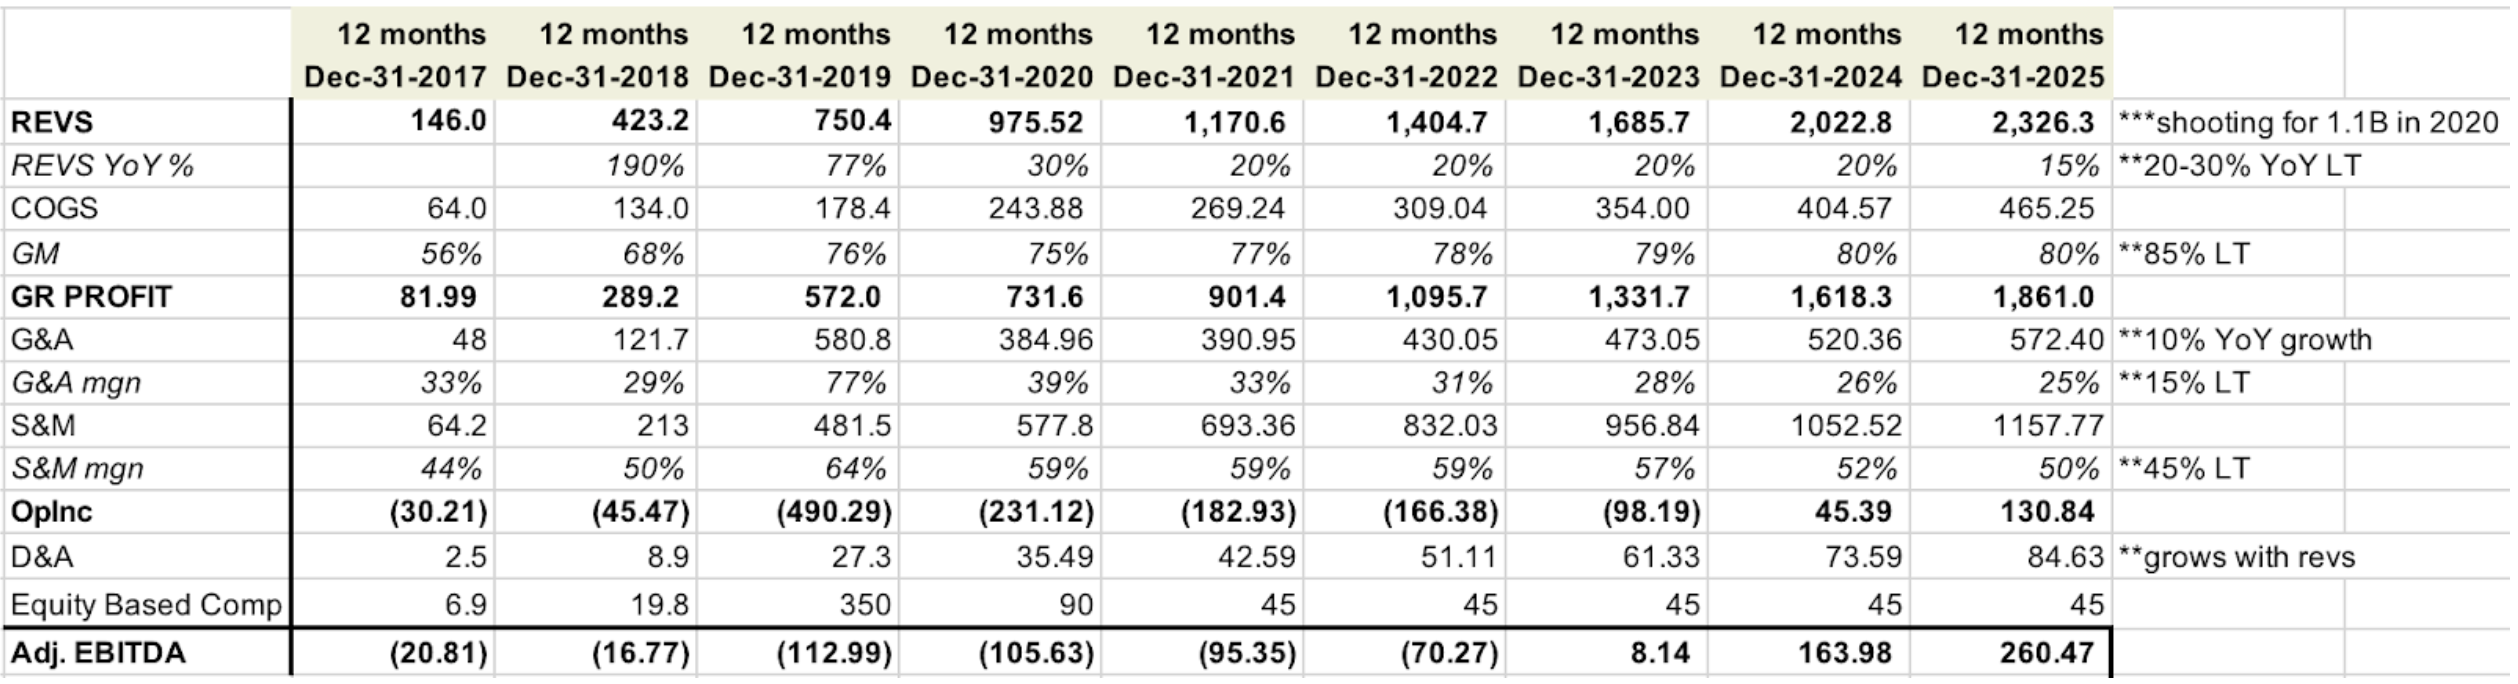
SmileDirectClub (SDC) is tired of $7,000 braces and exorbitant smile correction treatments. The founders, both millennials, claim that there is a massive opportunity for disruption in a market dominated by Align Technology’s Invisalign and traditional metal braces. Though 85% of the world suffers from malocclusion, these two products have monopolized the market for treatment. SDC offers a streamlined product with the same treatment as Invisalign, but with no extra middlemen. Rather than spend close to five figures on treatment, SDC charges roughly $1900 for their clear aligners via a mail-in teeth impressions kit, or a visit to one of their stores. 65% of people finance their SDC experience via SmilePay, which effectively charges an APY of 17%. Like Invisalign and braces, SDC can request insurers reimburse patients for a portion of the service. Over the last five years, the service has become popularized by celebrity endorsements on Instagram and a consumer-friendly image, growing their revenues from $146M in 2017 to $750M in 2019. The company guidance for 2020 is above $1B in sales.

SDC’s pitch to investors was well received as the stock rose nicely the week after its IPO. Since then, however, the price fell from $20 to $4 as Coronavirus fears and earnings misses handicapped confidence. Though general market sentiment seems pessimistic, SDC is poised to grow dramatically in the next few years, achieve profitability, and trade at expanded multiples. The Coronavirus fear provides an attractive discount to the intrinsic value of the company, which is poised to grow for a number of reasons:

  1. It promises to expand into geographies acrossthe globe, aiming for 10-20% growth domestically and 30% growth internationally. The company claims it is currently tapped into only 1% of the malocclusion market. Internationally, SDC is expanding into developed geographies similar to the US, like Australia, NZ, and the UK. The company sees roughly 500M potential customers, which translates into an $800B market (at $1700 ARPU). Transposing its experience growing in the US will prove beneficial during its international expansion.
  2. Domestically, SDC’s strategy is two fold. First, it plans on tapping into a younger market via targeted advertising for parents and young adults. Teens make up two-thirds of the smile-correction market, yet only 5% of SDC customers. This is a massive market opportunity that SDC is targeting by convincing parents that its less traditional alternative is comparable to the pricier Invisalign or more traditional metal scaffold. The second domestic pillar is operational leverage and increased cost efficiencies. Via higher volumes through its stores (which operate at a suboptimal 25% capacity) and wholesale partnerships with CVS and Walmart, SDC claims that significant operating leverage and lower customer acquisition costs (CAC) will drive profitability in 2021 and beyond.
  3. Focusing on back-end cost efficiencies should also improve all margin profiles. Gross margins are expected to reach 85% since all manufacturing is done in-house, as of 2019. The GM has climbed from 56% in 2017 to 76% in 2019. G&A costs, which were 77% of revenues (or 44% withoutstock based comp), are forecasted to decline to a long term goal of 15%. SDC claims back end efficiencies and “rightsizing” headcount should improve these margins, though I am skeptical that costs will decline to 15% of revenues (more on this later).

Recurring revenues will also begin to play a role as SDC customers purchase retainers and oral care products from the company every six months to maintain their corrected smile. These recurring revenues are now 3.4% of revenues, compared to 0.8% in 2017, and will continue to expand as the base of “treated” customers swells.

Digging deeper into the financials, we see SDC is well-positioned from a capital standpoint. It carries $300M in cash, $200M of long term debt, and access to a $500M credit facility from J.P. Morgan, with an option for an extra $250M.  The shares trade at $4 and carry $3.16 of tangible book value per share, which limits some downside on the stock. 

Though management is confident in its optimistic guidance, concrete plans are left undisclosed. The model below showcases a conservative take on management’s guidance. Rather than assuming 20-30% top line growth rates from the domestic teen expansion and international scaling as SDC claims, we can assume 20% growth in 2021 that tapers off to 15% in 2025. The gross margins, though estimated to improve from 76% to 85%, may be closer to 80% as the volume-driven ramp up may experience manufacturing headwinds (like in Q4 2019, though management promises these issues are addressed). In terms of G&A costs, the loosest part of management’s narratives, those are modeled to decline to 25% of revenues (versus management’s aggressive claim of 15%). Sales and marketing costs, which are vital to the business, grow slightly under projected revenue growth, achieving a conservative margin (1000bp worse than management’s prediction).

Given 2025 adjusted EBITDA, we can attach conservative multiples to the growth company of 10, 12, and 14x (note its competitor, Align Tech, trades at an impressive 17x). Assuming 300M of capital is used (cash or debt) up to 2025, we back into the following equity valuations and upsides from the current market price.

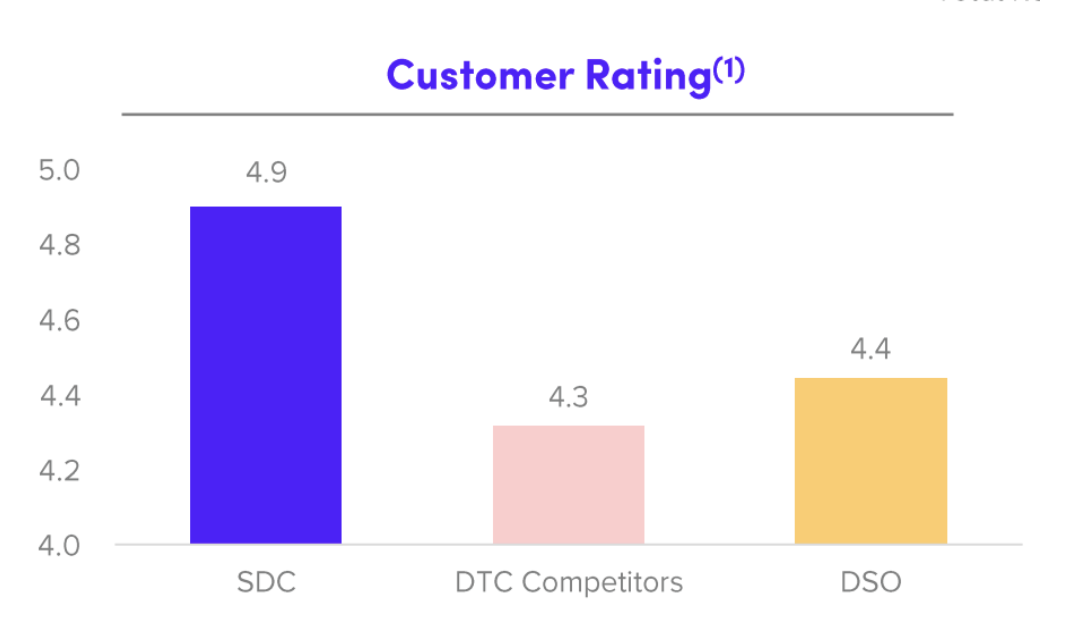
SDC’s stock took a dive for two main reasons. First, it disappointed investors with last quarter’s results, which were below guidance as the company could not keep up with demand in its manufacturing facilities. Secondly, the Coronavirus slammed most equities. SDC closed most of its stores worldwide, though anyone could still begin their treatment via their website. Last week, SmileDirectClub offered their 3D printing facilities to manufacture medical supplies for the Coronavirus crisis. Could a company with a 95% satisfaction rating of its plastic retainers live up to the arduous demands of Uncle Sam? Maybe. But when this virus too shall pass, SDC’s equity will begin to trade more like a promising growth story than a distressed plastics manufacturer.


MGM Resorts International: The Right Bet?

By Drake Mead

Recent Shifts in the Gambling Industry 

In 2018, the state of New Jersey won a landmark supreme court case, Murphy v. National Collegiate Athletic Association (initially Christie v. NCAA, but the case was renamed after Phil Murphy was elected governor). This case struck down the Professional and Amateur Sports Protection Act of 1992, which had basically given the state of Nevada a monopoly on sports gambling, and more importantly from the standpoint of gambling companies, limited their operations to the state of Nevada. This development caused the gambling industry to explode in New Jersey. By May 2019, only 11 months after the legalization of sports wagering in the state, New Jersey sportsbooks took in more in monthly wagers ($318.9 million) than Nevada ($318.3 million), and NJ repeated the feat in in July, taking in $251 million versus $235 million in wagers in Nevada. Note that the month-to-month change in wagers is not due to a slowdown in the industry, but rather because May is a much more active month sports-wise than July, with the NBA and NHL playoffs occurring. Multiple other states have legalized or are in the process of legalizing sports betting. Indeed, according to Morgan Stanley estimates, the legal sports gambling business will generate $7 billion in revenue by 2025, compared to $833 million this year, a 740% increase. That’s up from their $5 billion estimate last year, and in the (admittedly unrealistic) case that every state has legalized sports wagering by 2025, they estimate the industry will generate $15 billion. Clearly, due to legal changes, this industry is primed to explode.

Asset Light: A New, Innovative Strategy

Out of all the different firms vying for a piece of this proverbial sports wagering pie, MGM Resorts International (NYSE: MGM) stands out for their new, forward looking strategy and business deals they are taking to corner the market. MGM, sensing which way the wind is blowing, is currently implementing a strategy to make their company more “asset light,” reduce debt, and return capital to shareholders. This strategy in the long run will make the firm more flexible, and give them the cash to better break into the market in new states as they legalize sports wagering. This has manifested itself twice recently, first on October 15, when MGM agreed to sell two of its properties in Las Vegas, Circus Circus and Bellagio, for $4.3 billion, and again on January 15, when they agreed to sell MGM Grand and Mandalay Bay for $4.6 billion. They will continue to lease and operate the latter three properties. All of the properties were relatively old; all of them were at least 20 years old, and Circus Circus was opened in 1968). This transactions will also more than octuple MGM’s cash on-hand, from $1.23 billion (As of September 30, 2019) to about $10.1 billion before tax and transaction costs. This will be useful as they expand into new opportunities in online gambling.

MGM and the New Reality of Sports Gambling

MGM is quickly moving to increase its market share in new sports betting opportunities. In New Jersey, MGM holds an 8% market share in sports wagering among casino-operating firms. Although this number might seem low, that’s in part because sports gambling in NJ has historically been dominated by Resorts AC, the oldest and most famous Atlantic City Casino. In states other than NJ where MGM is a more recognizable brand than Resorts, MGM will likely be able to get a larger market share.

MGM is also actively moving to increase their market share in the online sports gambling industry. On October 29, MGM and Yahoo Sports announced an official partnership deal for BetMGM, MGM’s online sportsbook, to be integrated into the Yahoo Sports platform. This will come in the form of the ability to place wagers on games directly in the Yahoo sports app, and later on will involve “fantasy-style” gambling that is compatible with Yahoo’s already popular fantasy sports platform. This partnership with Yahoo will greatly increase BetMGM’s exposure to new, potential gamblers, increase accessibility to wagering, and grow revenues as it attracts more people to gambling. Additionally, MGM announced a partnership with Buffalo Wild Wings, the largest sports bar chain in America with over 1,200 locations, in September. This partnership currently includes BetMGM spreads and gaming information being displayed at the bar, and BetMGM is currently testing a program in NJ of giving some exclusive perks to those who use the MGM app inside the bar.  Although they did stop short of turning every Buffalo Wild Wings in America into a sportsbook, this will help increase BetMGM’s name recognition and increase revenues and market share directly by incentivizing bar-goers to use MGM’s platform.

Financials (All numbers in millions, except for valuation multiples)

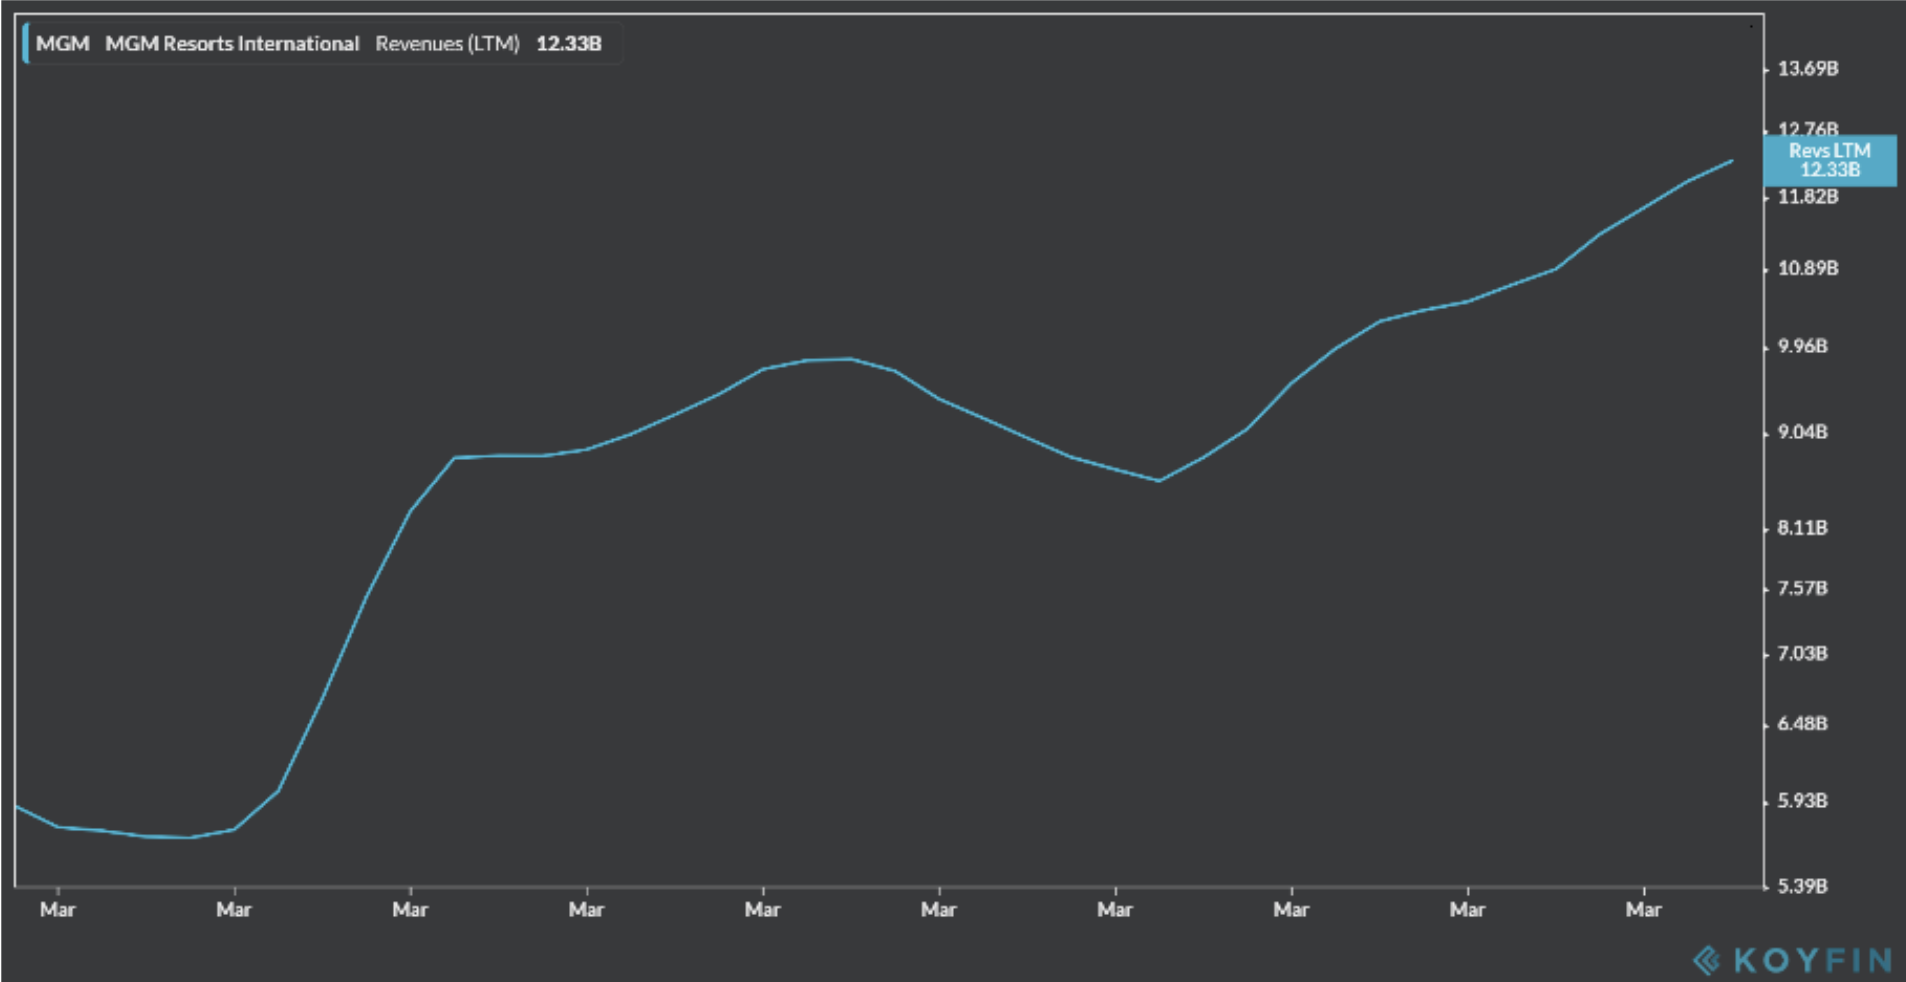
Revenue for the past decade
  • MGM posted revenues of $3,314 for Q3 2019, up 2.8% from Q2 and up 9.4% from Q3 last year
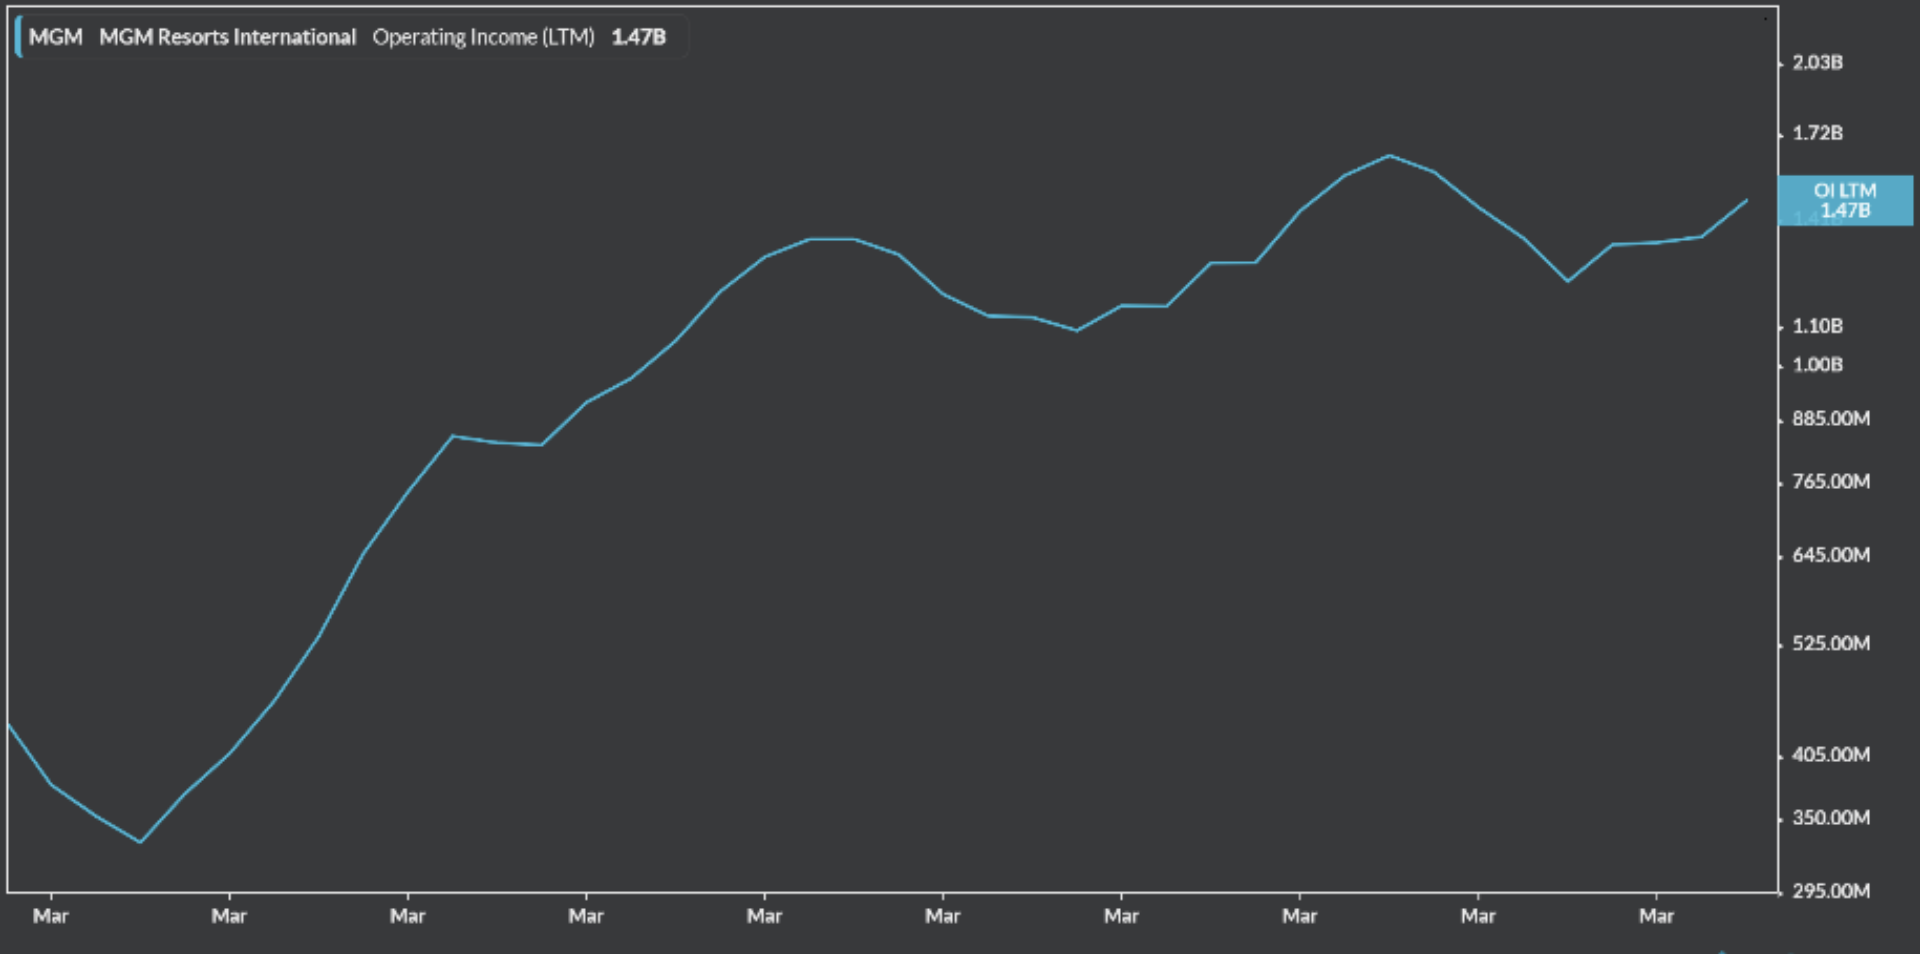
Operating income for the past decade
  • Operating income (Non-GAAP) was 452.0 for Q3 2019, up 21.8% from Q2 and up 10.2% from Q3 last year
  • EV/EBITDA- 10.5x
  • EBITDA margin: 20.69% in September, decreased slightly from 22.38 in August

From these numbers, I see MGM as a company with growing revenues and healthy financials. I also believe that a 10.5 EV/EBITDA multiple undervalues a company with such enormous potential for growth. For comparison, Las Vegas Sands has an EV/EBITDA of 10.9x, and Caesar’s Palace has a multiple of 11.0x. The only real causes for concern in their financials are that their EBITDA margin shrunk somewhat in September and their debt, the former I will cover now and the latter I will cover in the risks section. The slight decrease in EBITDA margin might concern some, however it is still on the higher end of EBITDA margins among its competitors. Part of this is seasonal, as the Q3 EBITDA margin for 2018 was also down from Q2 as Q3 contains some of the slowest months for sports gambling (July and August). For comparison, CZR has an EBITDA margin of 6.23%. The only competitor with a significantly higher EBITDA margin is Las Vegas Sands (NYSE: LVS), with a margin of 33.55%, whose owner has publicly said that he will not enter his company into online gambling in any way, a luddite mindset that I believe will hamper that firm’s growth in the future and allow MGM to take advantage of less competition from one of its biggest rivals in the gambling industry.

Risks (All numbers in millions)

One of the most immediately recognizable risks with MGM is that their interest payments are a large proportion of their operating income (in Q3 it was 47.6% of their operating income, and for FY 2018 it was 57.8%).These numbers might seem alarming, as bankruptcies in the casino industry, such as what happened to Caesars Palace (NASDAQ: CZR) in 2015 are not unheard of. However, MGM is undertaking debt reduction strategies to avoid this possible outcome. Although debt issuance has risen recently, they have also increased debt repayment. For example, in Q2 2019, MGM issued 2,500 in debt, but repaid 2,600. And with the money from the sale of several casinos, I do not foresee their debt being too big of an issue in the future. The sale, at $4,300, amounts to a significant proportion of their $14,943.9 long term debt load at 29%.  

Recommendation: Buy

Given MGM’s position in an industry that is primed for significant growth and their healthy financials, I recommend buying equity in the company. I believe that MGM will grow significantly in value as more and more states legalize sports wagering, and they grow their market share in states that already have sports wagering with their new asset light strategy and campaigns to expand accessibility to and recognition of the BetMGM online platform. 


The Fragile Future of AMC Theatres

By: Danny Irvine & Nathan Szeto

No informed investor needs to be told that the movie theater industry is in dire straits with the rise of streaming services like Netflix, Disney+, & Amazon Prime Video, to name but a few. So why in the world would you want to buy stock in any movie theater chain?

The answer: You wouldn’t.
Ok, great. But what about American Multi-Cinema, better known as AMC? It is the biggest movie theater chain in the world, after all. However, it didn’t get that way without taking on massive amounts of debt. This reality, coupled with decreasing revenue figures, market trends, and a poorly executed vision, has positioned AMC to be a poor stock pick within the near future, and a potentially catastrophic one in the event of a recession.

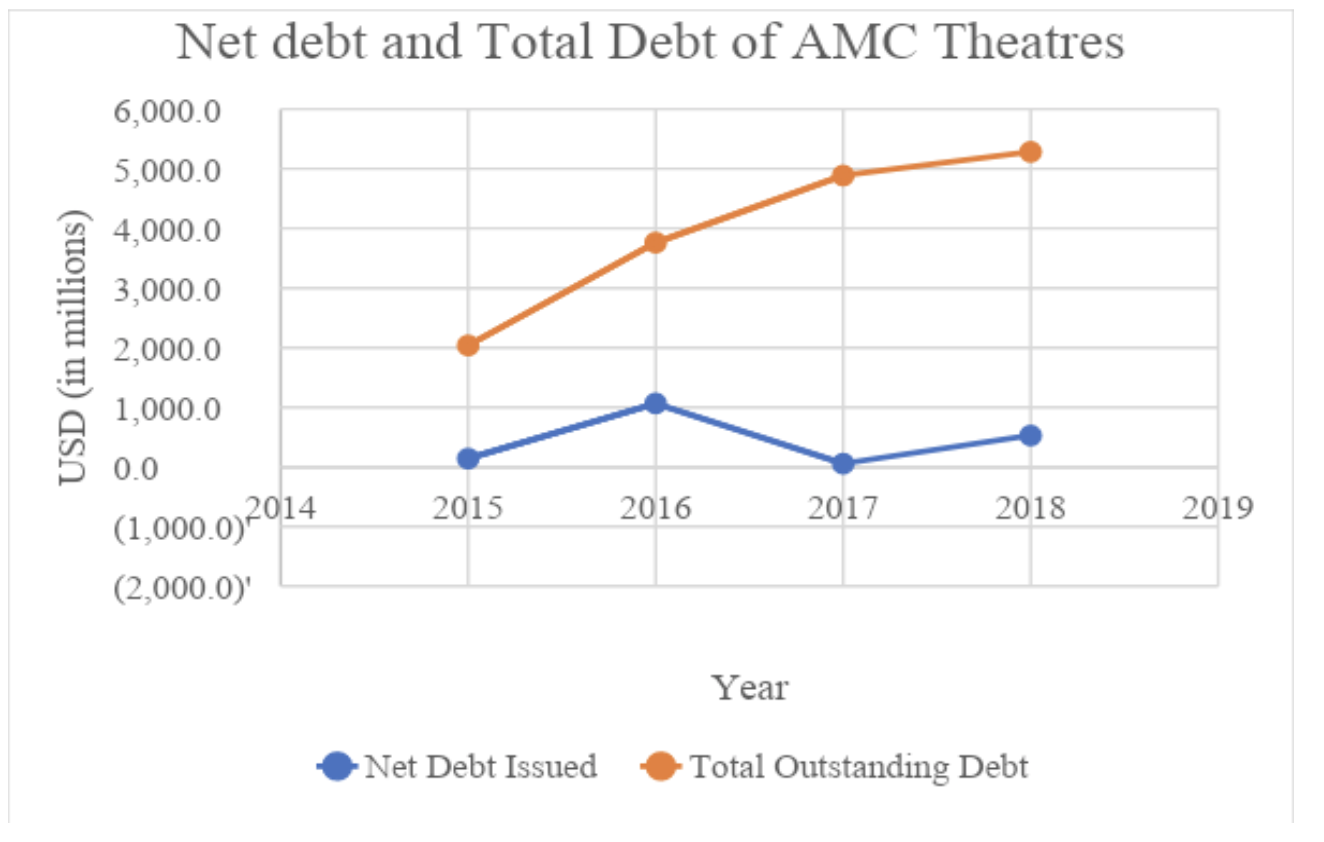
It may seem to the average investor that AMC has increased performance in recent years, and AMC’s yearly total revenues would support that assertion: in 2015, it produced $2.9 billion in revenue, and in 2018, it posted $5.4 billion, an increase of 86%. However, AMC’s revenue growth is deceivingly high because the company has not grown organically. Instead of committing to improving the movie-going experience for its customers, AMC’s corporate branch has embraced an expansion mentality. That’s right, the largest movie theatre company in the world is looking to increase their foothold in its stagnating industry via acquisitions. It’s important to note that we aren’t suggesting that AMC intends to monopolize, but rather it values quantity over quality of their theatres. Since 2015, it has acquired 700 theatres and has issued massive amounts of debt to fund these purchases. As can be seen in the chart below, the company’s total outstanding debt has exceeded $5 billion as a result. Seen in the same figure, the company’s net debt indicates the change in total debt. In 2016, AMC issued $1.75 billion in debt, all of which the company stated went to fund the acquisitions of movie theatre companies in Europe and Asia. In 2017, they made a large sum payment of $748 million to repay debt, but that hasn’t halted its persistently increasing amount of outstanding debt, which at the end of 2018 was $5.2 billion. Understandably so, being in the theatre business is very capital intensive, but the corporate acquisition strategy has jeopardized AMC’s future. The company’s financials reveal that its return on assets (ROA) percentage has been declining over the last few years. Since 2015, the ROA percentage has declined from 3.1% to 1.0%, with consistent decline each year, excepting 2018.

Figure 1: AMC Theatres total debt and net debt from 2015 to 2018

We’ve already mentioned that AMC is at risk of bankruptcy in the event of a recession, but what exactly do we mean? Given that AMC is already operating on very slim margins and is saddled with massive amounts of debt, it’s not too far of a stretch to believe that if the US economy experiences a recession, AMC will lose the ability to pay off its interest and eventually have to file for bankruptcy. For instance, with an operating income of $317 million and net income expense of $224 million, AMC has little room for error if their revenues drop even slightly. Also, the company’s net income margin percentage in 2019 was 0.2%, down from 9.6% in 2017, giving one a sense of just how slim the company’s margins are.

Think about it — is going to see the new Frozen 2 movie really a priority when you’ve just lost your job? (The answer should be no) Now multiply this sentiment by a few hundred million would-be moviegoers and you’ve got a bonafide crisis on your hands.

So why should we believe that a recession is imminent? According to a survey done of economists by the National Association for Business Economics, 3 out of 4 economists believe that the United States will experience a recession by 2021. Ray Dalio, founder of Bridgewater Associates, believes that prior to the 2020 election there is a 40% chance of a recession, up from 35% in February. These fears are supported by the ongoing trade war between China and the United States, as businesses scale back investment and struggle to maintain output levels. Lastly, within the last few months Treasury 10-year bonds fell below those of 2-year bonds. This situation, known as an inverted yield curve, has historically signaled that investors are reinvesting into safer assets and has preceded every recession since 1955. Even if these signals are all wrong, we are hard pressed to say there will not be a recession ever again. And when on hits, 2021 or 2025, AMC’s acquisition-fueled hopes and dreams will likely be demolished.

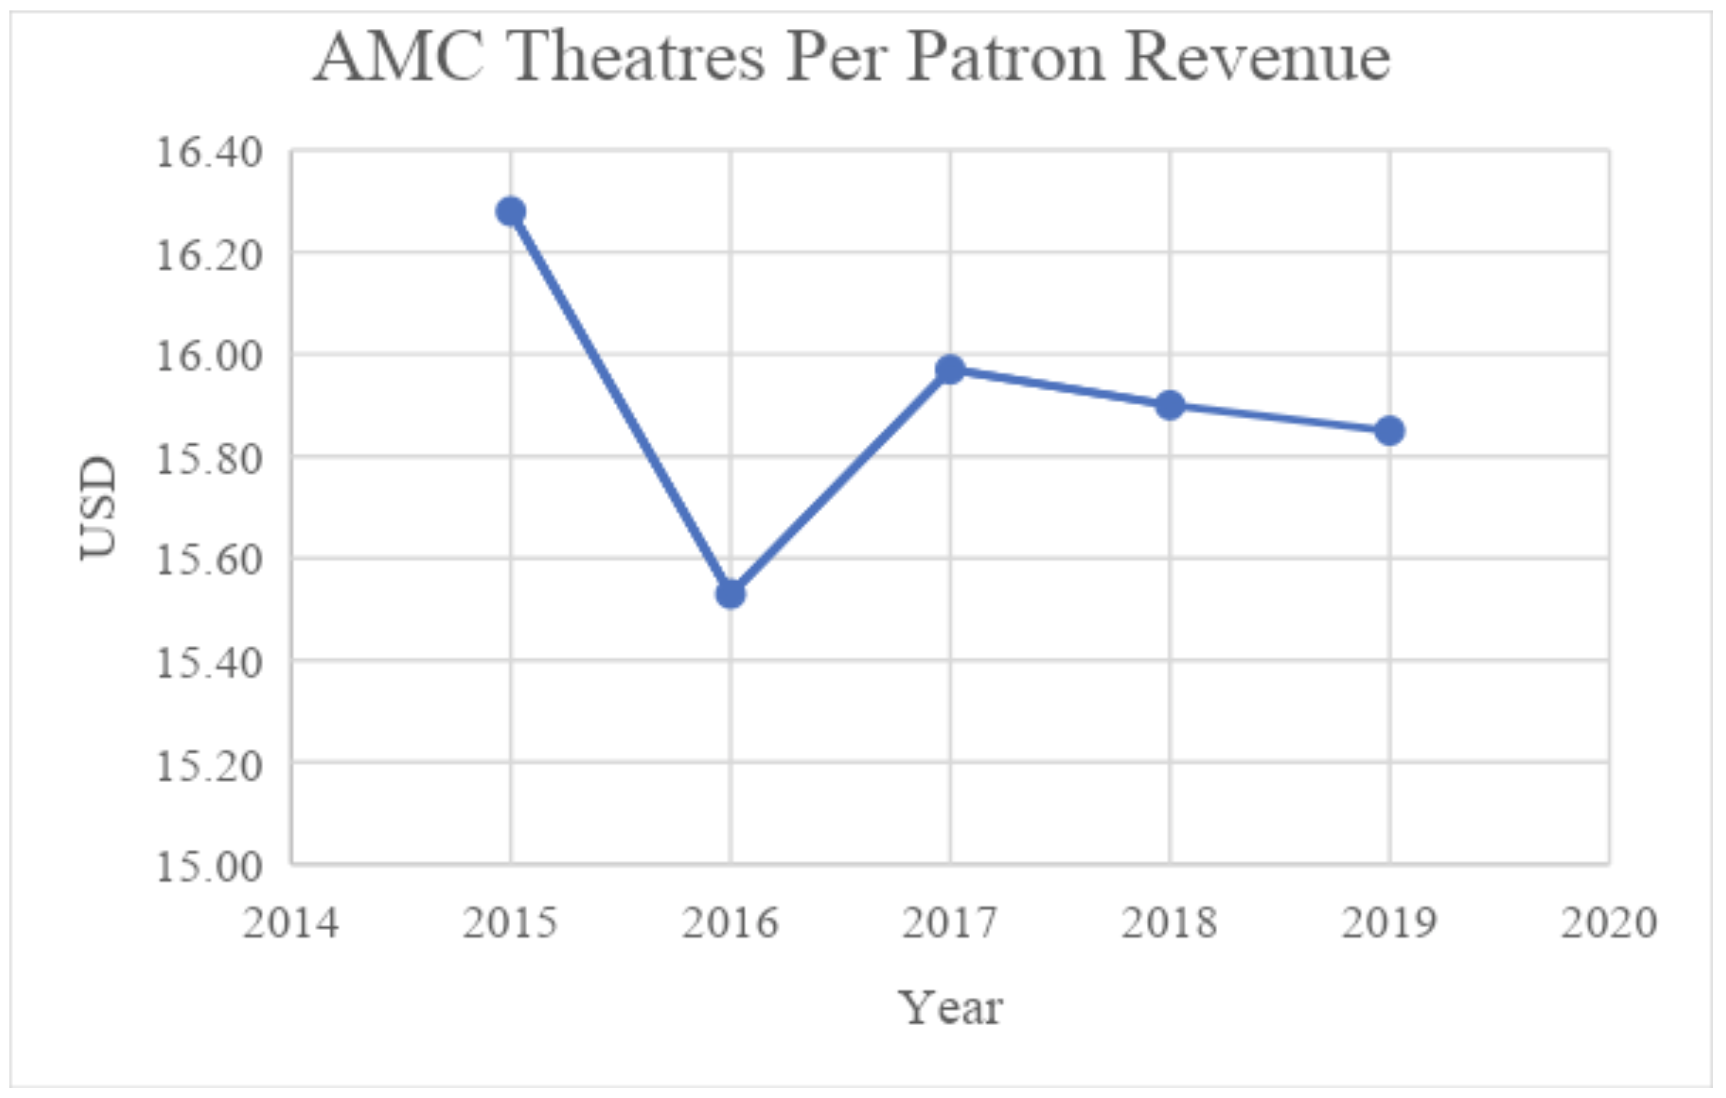
Figure 2: Per patron revenue from 2015 to 2019

AMC proponents would point out that the company has invested in the upkeep of some of its theatres to reduce asset depreciation. The most significant improvement was of 2,279 screens in 2018, with another 600 planned for 2019. Improvements include replacing traditional seats with fewer, but higher quality plush recliners, and improving dining options. This allows AMC to sell seats at higher prices with the goal of improving revenues per movie screen As of now, AMC improved over 2,200 screens, but they own 11,000 in total, leaving potential for a ton of  depreciation and high capital expenditures (likely via even more debt) to occur as improvements perpetuate.

We looked at AMC’s revenue per patron because it better indicates its revenue change organically (controlling for acquisitions), compared to their total top-line numbers. The statistic reflects the average amount of money AMC earns from each customer through the ticket and food and beverage purchases Conveniently, it doesn’t take into account quantity of customers, so we can examine solely the quality of how AMC obtains revenue. Since 2015, there has been a 7% increase in the number of patrons choosing to buy food and/or a beverage (from 64% to 71%), suggesting that revenue per patron should increase. However, the overall trend is decreasing. Figure 2 shows the revenue per patron adjusted for inflation from 2015 to 2019. Although the margins seem small, there is a 75-cent decrease per patron. Considering the many thousands of people that visit AMC’s theatres each year, that 75-cent decrease will significantly wound organic revenue streams. Overall, the company has extracted less money from the customer over time, which they hope to offset with their new streaming service.

As if those numbers weren’t already depressing enough, the company has demonstrated no clear vision for moving forward best embodied in its decision to launch a new streaming service, as if consumers weren’t already inundated with other options. However, to add insult to injury, they have decided to structure it in the worst possible manner. Known as “AMC Theatres On Demand,” as uninspired a name if there ever was one, it is nothing more than a glorification of Google Play or iTunes, versus a proper streaming service. At least Google Play and iTunes admit that they’re not good deals. On top of the $15 annual membership fee required to use the service, each and every film and show has to be either rented for $3-6 or bought for $10-20.  The movies are neither exclusive nor early access, as would be hoped for from the world’s largest movie chain. Even though the service provides in-theater benefits, value provided is still extremely poor and will likely fail to contribute to AMC’s bottom line meaningfully.

The launch of the streaming service is a symptom of a larger problem at the megacorporation that is American Multi-Cinema. That AMC’s leadership feels that yet another streaming service is necessary to raise profit margins indicates that it lacks the vision and creativity necessary to reverse the course of a company in an already dying industry. It reflects a management desperate to turn around a faltering company via uncalculated grasps for salvation.

The reality is that AMC is a company without ideas in a dying industry. Falling actual revenue per patron figures coupled with a massive debt load indicates that the company not only lacks future potential for growth but is extremely at risk of defaulting on its debts and filing for bankruptcy in the event of a recession. Worst of all, the debt AMC has accumulated has done little to grow its falling revenue.


Philip Morris (PM): Smoking hot! (Sort of)

By Michael Davis

As the parable goes, markets hate uncertainty. Right now, the tobacco industry has a lot of uncertainty. In the last decade, the percentage of adults who smoke decreased 700 basis points and increasing health-consciousness in the U.S. promises to decrease that number further. The government’s war against popular e-cig brand JUUL has not helped either. In the wake of 34 vaping related deaths, federal legislators have promised to introduce even more regulations onto the tobacco industry. These facts scare the market. But they shouldn’t scare you.

Enter Philip Morris International (PM). When I first started following PM back in September, the JUUL inquest was at its peak, an Altria-PM merger threatened PM’s independence, and the PM stock was trading at $71.90. My advice was to buy. I expected strong international sales, the introduction of IQOS (expanded upon below), and the fear of regulations to dissipate, all of which would culminate in a rebound. As of this article’s writing (1/15/20), PM trades at $88.80 (a 23.5% increase since I recommended buy). I was right. Dope. But now what? Is PM still a buy? My answer is still yes, but don’t expect the same fireworks.

Background:

After splitting from its parent company and JUUL owner, Altria, in 2008, Philip Morris has positioned itself as a top dog in the tobacco industry. And as the JUUL controversy has dampened Altria’s stock, Philip Morris has steadily rebounded and should continue to do so. As the industry transitions from combustibles to vapes, Philip Morris’ introduction of its IQOS product into U.S. markets will strengthen its foothold in the domestic market. And though this new e-cigarette is still only a piece of the Philip Morris pie, it has the potential to propel its parent company for years to come. So, what is IQOS? In real terms, it is a new type of e-cigarette that heats tobacco instead of burning it. This difference has been Philip Morris’ battle cry as they’ve marketed the product throughout the world, as they claim the heating process significantly reduces the level of harmful chemicals introduced into the lungs. The FDA maintains that tobacco in any form is dangerous, but if JUUL has taught us anything, it’s that consumers don’t particularly care. And while international markets have responded well to IQOS for some time, the U.S. foothold will prove crucial to its success. Currently, IQOS is the only FDA-approved heat-not-burn tobacco device and has only just been introduced to U.S. markets. In financial terms, IQOS is the catalyst for strong future growth that will maintain the historical financial strength of PM.

Financials:

On a scale of feta cheese to superman, Philip Morris’ financial strength comes in around the 7.5 mark. Despite the uncertainty in the tobacco market and the decreasing consumer base of tobacco users, revenues have only dropped 3% over the last five years. And while its EV/EBITDA is 12.74 compared to the EV/EBITDA of its biggest competitor, Altria, of 10.4, the real value in owning PM derives from the dividend. Currently, PM pays out $4.59 per share at a payout ratio of 95%. And while some of your alarm bells might ring at the huge portion of revenues going to that dividend, know that PM has increased its dividend for 11 straight years, even through the recession while maintaining their historically strong revenues. So, if a recession yanks PM’s value from its steady climb, the dividend will play the part of velvet pillow to land on. So, while the value of PM probably will not climb 23.5% again in the next four months, there are plenty of reasons to own this heater of a stock.

Microsoft: Bandwagon Buy, Or Calculated Investment?

By: Shayan Moazeni

You are on a random walk down some street (let’s say it’s not Wall Street). You ask a random stranger for stock ideas. Off the top of their head, they will recite the FAANGs — large household companies like Amazon, Apple, and even Microsoft. At first sight, a stock that the Average Joe recommends is likely not a clever investment. But Microsoft continues to profitably reach for the clouds.

Microsoft (NASDAQ: MSFT) has had quite a year: its stock is up 46% (YTD) and it has won two government contracts, worth a total of $17.6B over the next ten years, to provide the federal government its dominant hybrid cloud product. Azure, its cloud system, is the competitive advantage that, along with the unique breakdown of Microsoft’s revenue, transforms the company from just a “bandwagon” buy to a calculated investment. I will analyze both of these points in the rest of the article.

Figure 1

A Deeper Dive Into The Business

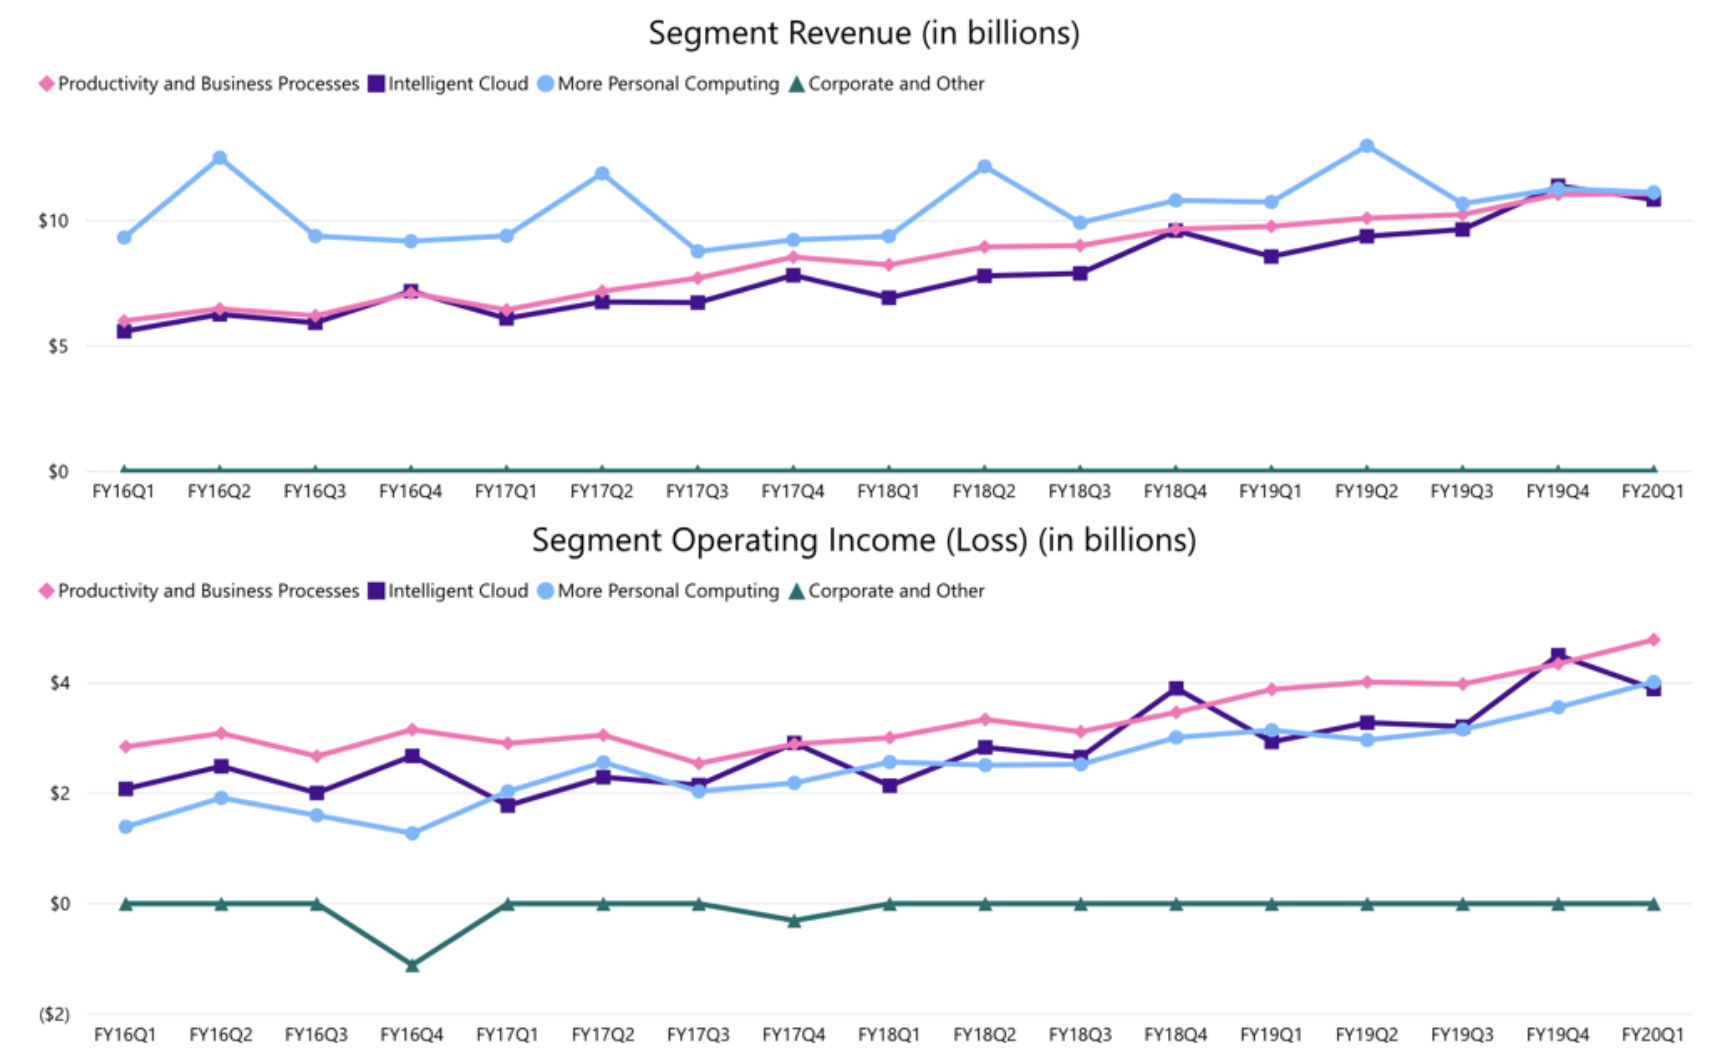
Microsoft’s revenues and operating income are both up 21% (YoY) this year, but what makes this growth more impressing than that of, say, Apple, is the structure: while over 52% of Apple’s revenues come from the iPhone, Microsoft’s cash flows stem almost perfectly evenly from three segments: “Productivity and Business Management”, “Intelligent Cloud”, and “More Personal Computing.” This even distribution of income greatly reduces the risk of revenue loss from a single product, putting the firm in the best position for the long run.

  • In Productivity and Business Management, revenues are up $1.3B (13%) for the quarter, $807M of which is from Microsoft Office (a 13% increase), and $379M of which is from Microsoft’s new acquisition, LinkedIn (a 25% increase, already proving to be a smart investment). These two platforms have helped the 16% increase in gross margins in the segment, leading to an impressive 23% increase in segment operating income.
  • In More Personal Computing, revenues are up $387M (4%) for the quarter, lifted by a 9% increase by Windows and 11% increase in search advertising, while gaming revenue is down 7% due to the cyclical nature of the sales of the Xbox (revenues from hardware sales are down because the latest Xbox was released in 2013, but content and services revenues are unchanged). Operating income increased 28% due to a shift to higher margin businesses, among other things.

This brings us to the main focus point of the article, Microsoft Azure, which currently accounts for 32.8% of Microsoft’s revenues. Running on a 36% operating margin, revenues and operating income from Azure are both up 21% (YoY) thanks to the strong hold Microsoft has on the cloud market, with a market share of 17.7% in 2018 and 18.2% in 2019. As mentioned before, Microsoft has also secured two contracts with the federal government for its hybrid cloud system, adding $633.6M to its annual operating income over the next 10 years. The hybrid cloud allows users of Azure with sensitive information to secure most of their information on the cloud system but keep certain bits of the data offline to prevent Microsoft, hackers, and other third-party users from accessing the information. By fixing this issue, Microsoft has opened its cloud system to hundreds of potential clients who may have previously been hesitant to storing their data on Azure. 

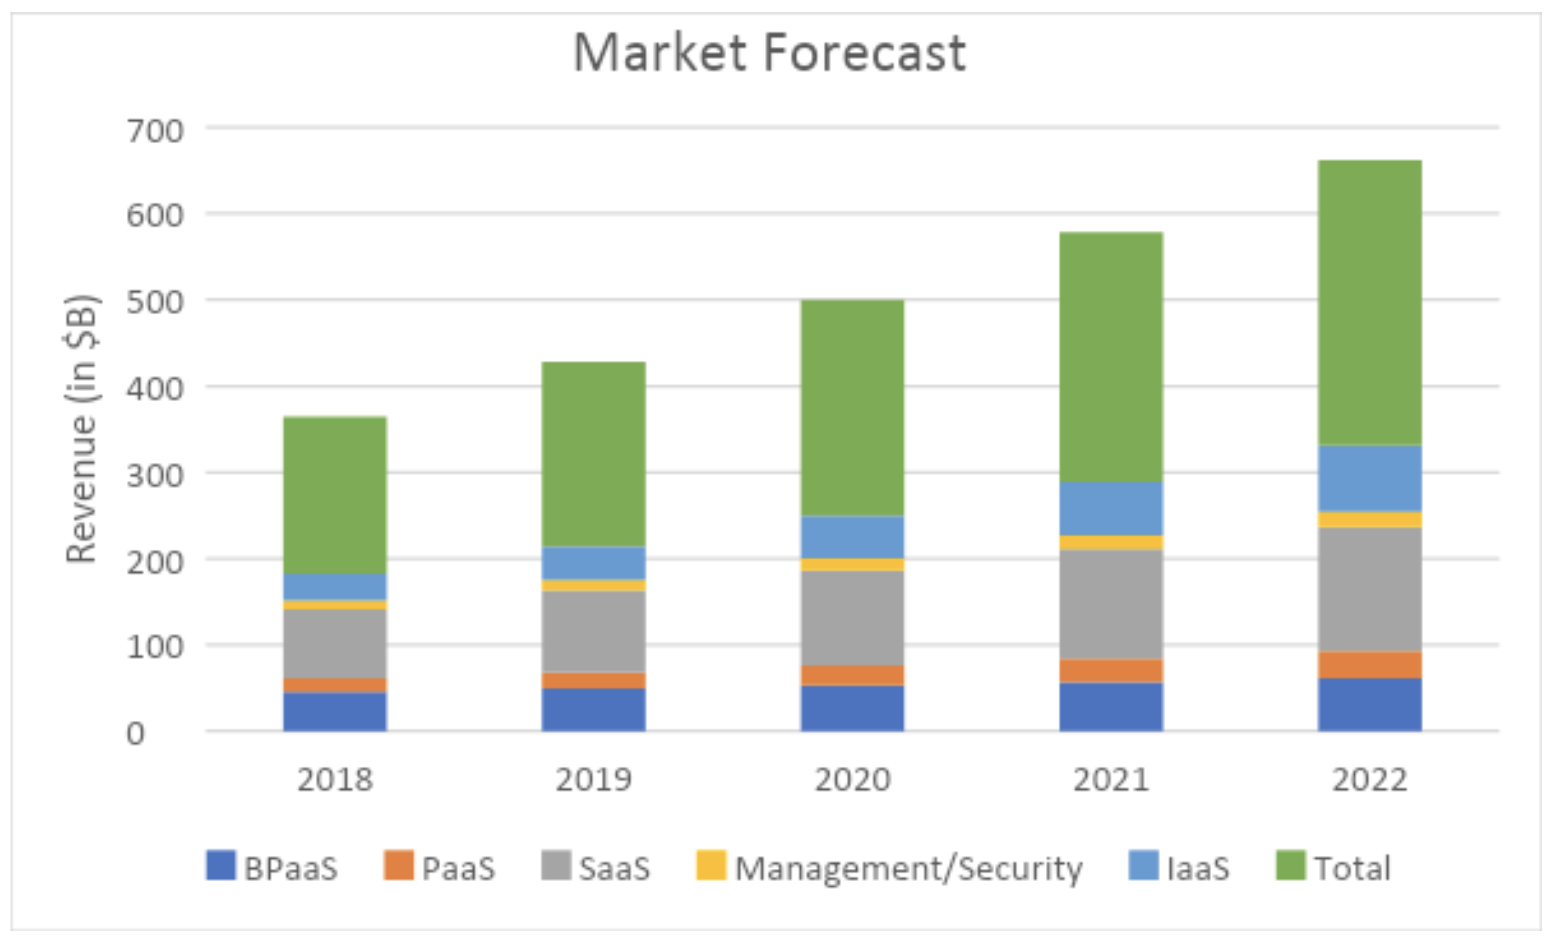
An analysis of the market for cloud supports this. As Gartner reports [1], the annual revenue generated from cloud activities across the market is predicated to grow from $214B in 2019 to $331.2 by 2022, a 55% increase. 

Figure 2


Valuation

In the first two segments, not much is expected to change for Microsoft save for the release of the new Xbox in 2020. Since Microsoft’s margins are surprisingly low on the Xbox hardware [2], the release of the new Xbox will not have a significant impact on the net cash flows to the company and gaming EBIT will continue to mostly stem from subscriptions and games, which are not subject to much change. For this valuation, despite the impressive growth in Productivity and Business Management and More Personal Computing segments (average growth of 24% and 23% respectively), I will assign a conservative 20% annual growth to those segments through 2022.

Finally, the cloud business. According to the aforementioned market forecast data, total revenue generated in the cloud business grew 17.5% from $182B in 2018 to $214B in 2019. In the same year, Microsoft’s cloud revenue (and EBIT) grew 21%, asserting its dominance over the cloud market. Due to Microsoft’s strong hold on the market, it is reasonable to expect this trend of beating the cloud market to continue. Below is a numerical summary of figure 2 along with Microsoft’s expected revenue from its (linearly) growing market share as well as Microsoft’s expected EBIT (using it’s consistent 36% operating margin) which also includes the annual $633M income from its two government contracts.

Segment/Year 2018 2019 2020 2021 2022
Total Market Revenue 182.4 214.3 249.8 289.1 331.2
MSFT Market Share  17.70% 18.20% 18.70% 19.20% 19.70%
Microsoft Rev 32.23 38.99 46.7126 55.5072 65.2464
EBIT (with gov contract) 11.52 13.92 17.45 20.616 24.122
Growth (YoY) 21% 25% 18% 17%

Figure 3: all raw values are in billions of dollars

As the model suggests, Microsoft’s operating income from cloud will double by 2022. Using this value and the expected growth in the other two segments, I predict Microsoft’s future EBIT as follows:

Segment Business Cloud Personal Comp Total
EBIT 29.6 24.12 23.6 77.3

Figure 4: all values are in billions of dollars

Using the consistent EV/EBIT ratio of 23 for Microsoft in recent years, this yields the following values for enterprise value. With a steady net debt of $50B, I have estimated the following values for market cap (EV+net debt) and thus share price (with 7.7B shares outstanding).

Enterprise Value Market cap Share Price Return
$1.778.9T $1.828.9T $237.5 59%

Figure 5: 

One obvious question here is whether the current EV/EBIT of 23x is an overvaluation. Below are the share price and EV/EBIT ratios for Microsoft and Apple.

If Microsoft’s EV/EBIT catches up to its share price in a similar manner to Apple’s, we can expect a multiple over 30x according to the graph, which can result in the following valuation in 2022:

Enterprise Value Market cap Share Price Return
$2.320T $2.370T $307.8 106%

General Mills Can Make You the Big Bills: Why GIS is Worth the Risk

By Nilay Neelaveni

In this article, I will be covering General Mills (GIS), a consumer food manufacturer and marketer. Its many well-known brands include Annie’s Homegrown, Yoplait, Pillsbury, and Cheerios. 

From 2018-2019, net sales changes were characterized by cereal’s flat performance, yogurt’s 2% dip, and snack’s 4% drop (GIS’s main business segments). The growth driving capabilities mentioned in the investor presentations—improving packaging and pricing, innovating products, improving e-commerce (i.e. Boxtops), building more sponsorships, and increasing media coverage – provided reasons for optimism. Apart from GIS’s main products, it also started pushing more BLUE pet food, an area with lots of potential for growth because of the expanding market. Q3 2019 displayed flat growth in net sales of GIS’ main products like cereal (677.1 to 685.5 million), yogurt (514.8 to 495.2 million), and snacks (887.9 to 869.4 million). Pet net sales, however, grew approximately 458% (14.5 million to 80.9 million), which is a mix of investment and true organic growth. While net sales barely grew, GIS estimates that its net sales will grow 9 to 10% from the current $15.7 billion based on the investor presentation. Also important is that EPS also grew from .66 to .86 per share, indicating better financial health. Though it may seem like GIS’s main products are going nowhere, a glimpse into the slight upward trend of its market share and its main business segment sales, combined with the initiatives described above are promising. 

Though it may take some time for these sales to grow, GIS is knee deep in cost savings programs that are estimated to increase savings in 2019 according to their investor presentation. The positive trend of its food groups and increased savings means this company still has so much potential to grow with regards to growth in revenues and minimizing costs.


It is first important to note the EV/EBITDA also increased from 11.7x (2018) to 12.5x (2019). EBITDA has remained flat from 2018 to 2019 while EV has increased by about 10% from 420.3 to 460.0 million. In addition, the massive debt on this large company should not be a worry since the interest coverage ratio of 12.56x means this large cap company can cover its interest payments. On top of all this, strategic revenue management has helped increase operating profit margins to 18% from 16%. Furthermore, because the EPS has increased, dividend yield can remain at a 3.60%, which is the highest of its competitors.

This company has its sail set in the right direction as we have seen by the promising changes in GIS’s business model. As the revenue grows and costs decline, the net income and profits will grow significantly, which can translate into the share price. If these signs hold true, I believe this company is a buy.