Fox: Tune Into Profits

By David Shakirov

Fox Corporation (NYSE:FOXA)

Fox Broadcasting Company - Wikipedia

Market Cap EV P/E Net Income Mgn Net Debt/EBITDA Proj. Upside (2024)
$17.6B $21.5B 11x 13% 1.1x +119%

Fox Corp is a media conglomerate operating in two main segments, TV and Cable.. The TV segment has local stations covering <40% of the US population, the Fox channel, and digital operations like Tubi, Fox.com, Fox Nation SVOD, Fox Soul AVOD, etc. The Cable segment has Fox News, Fox Sports, Fox Business, FoxNews.com, etc. Both the Cable and TV segments are monetized by “affiliate revenues” (i.e. subscription $ from providers) and “ad revenue”. The misc. segment includes a fin-tech called Credible, an animation studio Bento, and Fox Studios.

The company’s core assets — the Fox channel, Fox local news, Fox News, Fox Sports, and Fox Business — are high quality, durable crown jewels generating steady cash flows. Its other tech-focused assets like Tubi and Credible are grossly undervalued by the public markets. This memo will split Fox Corp’s business into five segments and value each by piece.

Fox’s channels are considered to be the most valuable asset of a cable or broadcast bundle, exemplified by the propensity of cable companies to eat up Fox’s affiliate fee hikes of ~10%/year. Fox’s digital strategy – across the online radio, web, social media, and Fox Nation – develops online engagement. Finally, Fox can capture the upside as users move from traditional TV to free ad-supported on-demand content, especially as advertisers pay to target Tubi’s young users, ~90% of whom cannot be reached via trad. cable.  Interestingly, Fox has a stake in fintech Credible, sports betting through Flutter/FanDuel, livestreaming via Caffeine + a $1.5B tax shield

Broadcast Television

Projected 2024 EBITDA $884mm
EV/EBITDA Multiple 6x
EV of Segment $5.3B

This segment includes the Fox channel, which is the most-watched broadcast station, with ratings 31% higher than the #2. Fox Corp also owns 29 local news channels (11 are duopolies) covering 40% of the US, where the local news industry has grown at 4% CAGR since 2015. Importantly, roughly 80% of its content across this segment is viewed “live” 90% of the time (e.g. news, sports, etc.), not O.D. However, this is the least compelling segment as it’s not a premium offering with margins <10%.

Tubi

Projected 2024 Revenue $351mm
EV/Revenue Multiple 6x
EV of Segment $2.1B

Tubi is an extremely interesting opportunity for Fox. Tubi provides an on-demand platform of free-to-watch content supported by ads (aka “AVOD”). AVOD is very important in the streaming world as it provides a free on-demand streaming option for younger audiences, 81% of which want to accept ads for free content (especially as Netflix/Hulu keep hiking prices). This digital-streaming solution is highly prized by Wall St. since it represents the post-cable future. Comps trade at ~6x revenues and roughly $20-30 valuation/user. Given Fox already has a vast collection of content, it can “recycle” it for free on Tubi and generate valuable digital ad revenues (targeted digital ads are worth much more than OTT-broadcast TV ads). Tubi grew +100% last year and now has close to 40m registered users. Very importantly, 87% of Tubi’s users cannot be reached by cable advertising, so they are a highly valuable user base. Fox bought Tubi in early 2020 for $450m, after selling its stake in Roku for a $300m profit. Tubi’s revenues are expected to surpass Fox’s primetime broadcast-ad revenues (which I estimate to be close to $400m). I estimate Tubi’s valuation as of 01/21 to be ~$700m (so, 2x long-term revenue vs. 6x+ comp.). The long-run value and potential of the AVOD business is exciting, yet not baked in the market value of Fox.

Cable Television

Projected 2024 EBITDA $2.7B
EV/EBITDA Multiple 12x
EV of Segment $32.8B

Fox News, Fox Business, and Fox Sports are premium offerings available through cable subscriptions + supplemental online content, podcasts, radio, digital, etc.. Controversy and political bias aside, Fox News is the highest rated cable TV channel and Fox Business has higher ratings comparable to CNBC. Both are watched by relatively affluent audiences (better ad dollars). FoxNews.com is a digital leader with 11x as many impression-minutes as ABC.com, 7x CBS.com, 6x NBC.com, and 2x NYtimes.com. Its supplemental subscription digital offering, “Fox Nation”, has a loyal base with a 80%+ convert from free trial to paying subscriber. Overall, this is a premium, high-quality, durable segment which operates at ~50% EBITDA margins and warrants at least a 12x multiple.

Credible

Projected 2024 Revenue $220m
EV/Revenue Multiple 5x
EV of Segment (67% stake) $737m

Fox acquired 67% of Credible for $265m in 10/19. Credible is an online financial technology company offering loan comparison tools. Previously, Credible was publicly traded. The revenues doubled from 03/19 to 03/20, and now likely crossed $100m in annual run-rate revenue. Credible has some synergies with Fox Business, and was fast-growing before the Fox relationship. On its own, Credible is disruptive, and successful, but the specific synergies between the two businesses are unclear.

Other
Fox a few other interesting features:

  • 3% ownership in Flutter and an option to acquire up to 18.5% of FanDuel
    • Synergy between increasingly legalized sports betting market and Fox Sports
    • Stake currently worth ~ $400m (but poised for growth as sports betting expands)
  • Full ownership of Bento, which is a well-respected animation studio (behind Bob’s Burgers, Central Park, etc.)
  • Full ownership of Fox Studio Lot
  • Minority ownership of Caffeine, a social-media live-streaming start-up ($600m valuation)
  • $1.5B tax shield post-C21 separation

Model and Valuation Summary

Smile Direct Club: Cheap Grins, Cheaper Stock [Sold]

By David Shakirov

UPDATE (03/26/2020): After a smashingly lucrative three day run (a 50% GAIN), the author recommends selling SDC stock. Though long term fundamentals are strong, the stock’s takeoff of 50% since the recommendation places it ABOVE the 8x EV/EBITDA target of 2025. At this valuation, the risk return profile on the company is unattractive. Here is an updated projected returns chart from the stock price as of this writing ($6.37). I recommend booking these gains of 49.5%, or 39% above the S&P 500, now.

\\\———————————————————————————————————————————///

ARTICLE:

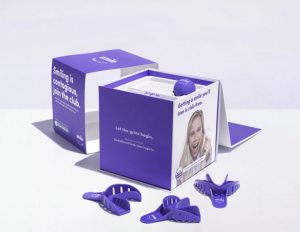
SmileDirectClub (SDC) is tired of $7,000 braces and exorbitant smile correction treatments. The founders, both millennials, claim that there is a massive opportunity for disruption in a market dominated by Align Technology’s Invisalign and traditional metal braces. Though 85% of the world suffers from malocclusion, these two products have monopolized the market for treatment. SDC offers a streamlined product with the same treatment as Invisalign, but with no extra middlemen. Rather than spend close to five figures on treatment, SDC charges roughly $1900 for their clear aligners via a mail-in teeth impressions kit, or a visit to one of their stores. 65% of people finance their SDC experience via SmilePay, which effectively charges an APY of 17%. Like Invisalign and braces, SDC can request insurers reimburse patients for a portion of the service. Over the last five years, the service has become popularized by celebrity endorsements on Instagram and a consumer-friendly image, growing their revenues from $146M in 2017 to $750M in 2019. The company guidance for 2020 is above $1B in sales.

SDC’s pitch to investors was well received as the stock rose nicely the week after its IPO. Since then, however, the price fell from $20 to $4 as Coronavirus fears and earnings misses handicapped confidence. Though general market sentiment seems pessimistic, SDC is poised to grow dramatically in the next few years, achieve profitability, and trade at expanded multiples. The Coronavirus fear provides an attractive discount to the intrinsic value of the company, which is poised to grow for a number of reasons:

  1. It promises to expand into geographies acrossthe globe, aiming for 10-20% growth domestically and 30% growth internationally. The company claims it is currently tapped into only 1% of the malocclusion market. Internationally, SDC is expanding into developed geographies similar to the US, like Australia, NZ, and the UK. The company sees roughly 500M potential customers, which translates into an $800B market (at $1700 ARPU). Transposing its experience growing in the US will prove beneficial during its international expansion.
  2. Domestically, SDC’s strategy is two fold. First, it plans on tapping into a younger market via targeted advertising for parents and young adults. Teens make up two-thirds of the smile-correction market, yet only 5% of SDC customers. This is a massive market opportunity that SDC is targeting by convincing parents that its less traditional alternative is comparable to the pricier Invisalign or more traditional metal scaffold. The second domestic pillar is operational leverage and increased cost efficiencies. Via higher volumes through its stores (which operate at a suboptimal 25% capacity) and wholesale partnerships with CVS and Walmart, SDC claims that significant operating leverage and lower customer acquisition costs (CAC) will drive profitability in 2021 and beyond.
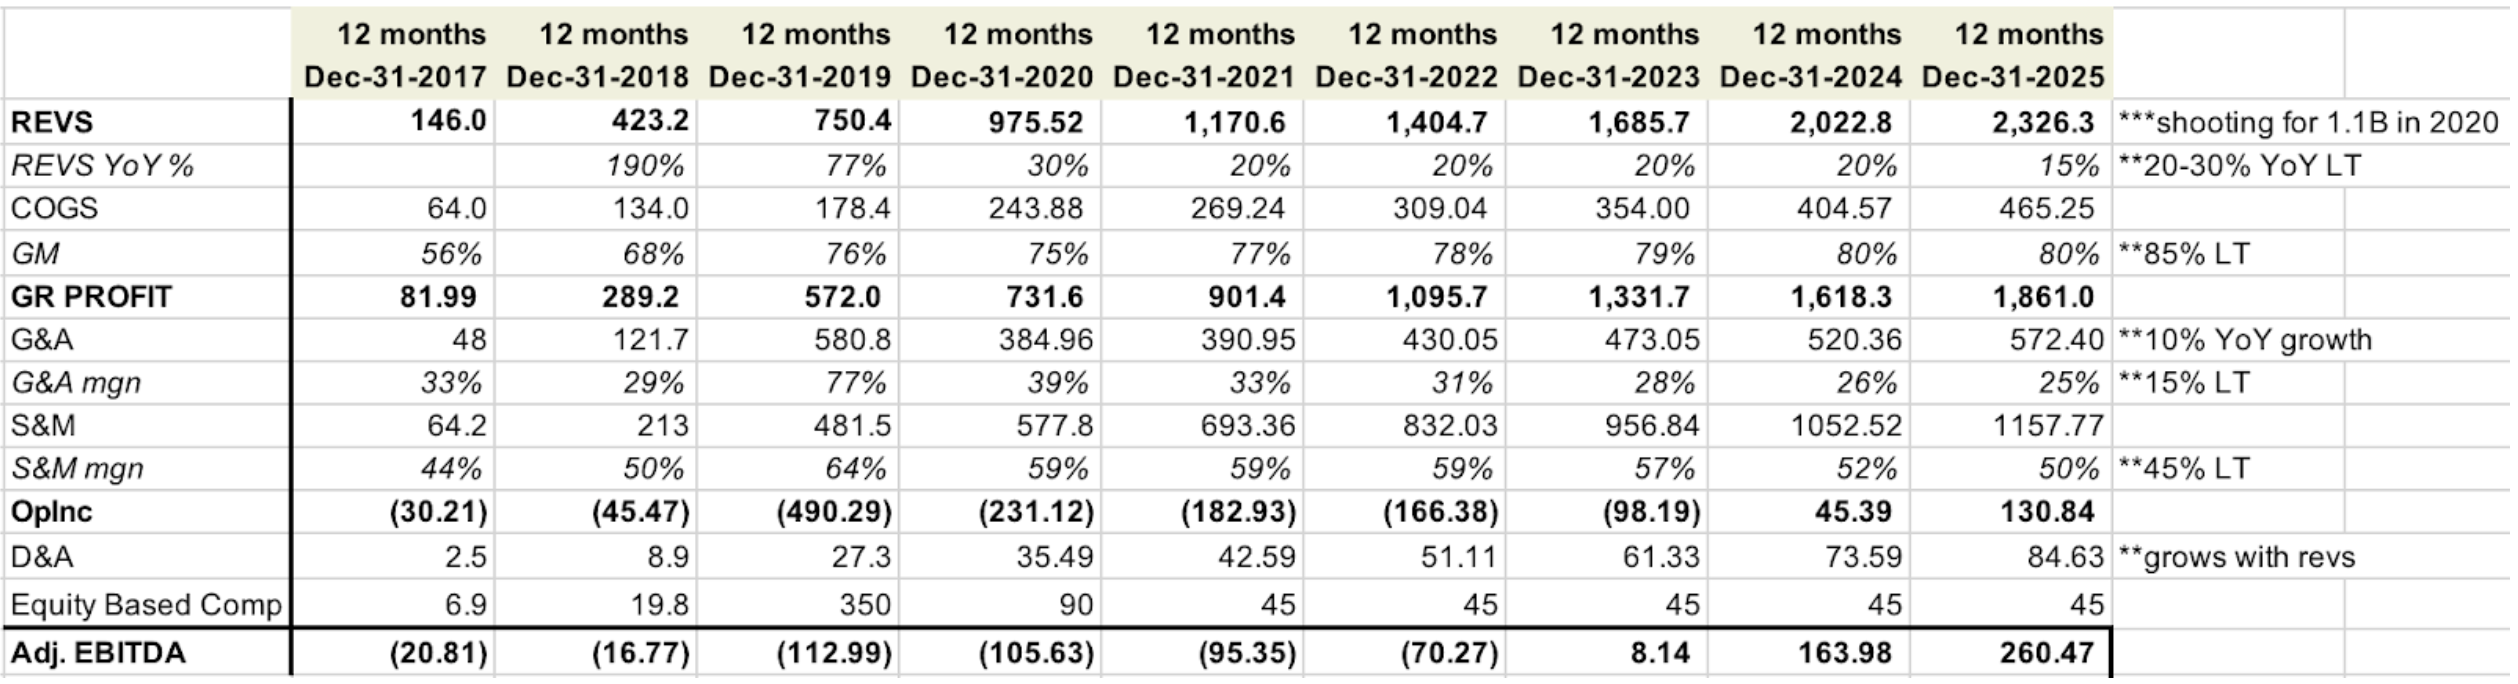
  3. Focusing on back-end cost efficiencies should also improve all margin profiles. Gross margins are expected to reach 85% since all manufacturing is done in-house, as of 2019. The GM has climbed from 56% in 2017 to 76% in 2019. G&A costs, which were 77% of revenues (or 44% withoutstock based comp), are forecasted to decline to a long term goal of 15%. SDC claims back end efficiencies and “rightsizing” headcount should improve these margins, though I am skeptical that costs will decline to 15% of revenues (more on this later).

Recurring revenues will also begin to play a role as SDC customers purchase retainers and oral care products from the company every six months to maintain their corrected smile. These recurring revenues are now 3.4% of revenues, compared to 0.8% in 2017, and will continue to expand as the base of “treated” customers swells.

Digging deeper into the financials, we see SDC is well-positioned from a capital standpoint. It carries $300M in cash, $200M of long term debt, and access to a $500M credit facility from J.P. Morgan, with an option for an extra $250M.  The shares trade at $4 and carry $3.16 of tangible book value per share, which limits some downside on the stock. 

Though management is confident in its optimistic guidance, concrete plans are left undisclosed. The model below showcases a conservative take on management’s guidance. Rather than assuming 20-30% top line growth rates from the domestic teen expansion and international scaling as SDC claims, we can assume 20% growth in 2021 that tapers off to 15% in 2025. The gross margins, though estimated to improve from 76% to 85%, may be closer to 80% as the volume-driven ramp up may experience manufacturing headwinds (like in Q4 2019, though management promises these issues are addressed). In terms of G&A costs, the loosest part of management’s narratives, those are modeled to decline to 25% of revenues (versus management’s aggressive claim of 15%). Sales and marketing costs, which are vital to the business, grow slightly under projected revenue growth, achieving a conservative margin (1000bp worse than management’s prediction).

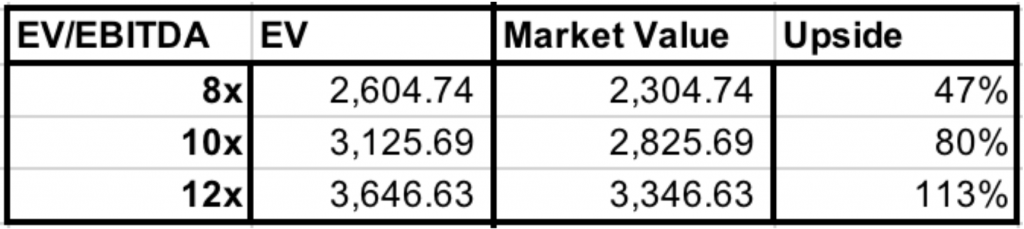
Given 2025 adjusted EBITDA, we can attach conservative multiples to the growth company of 10, 12, and 14x (note its competitor, Align Tech, trades at an impressive 17x). Assuming 300M of capital is used (cash or debt) up to 2025, we back into the following equity valuations and upsides from the current market price.

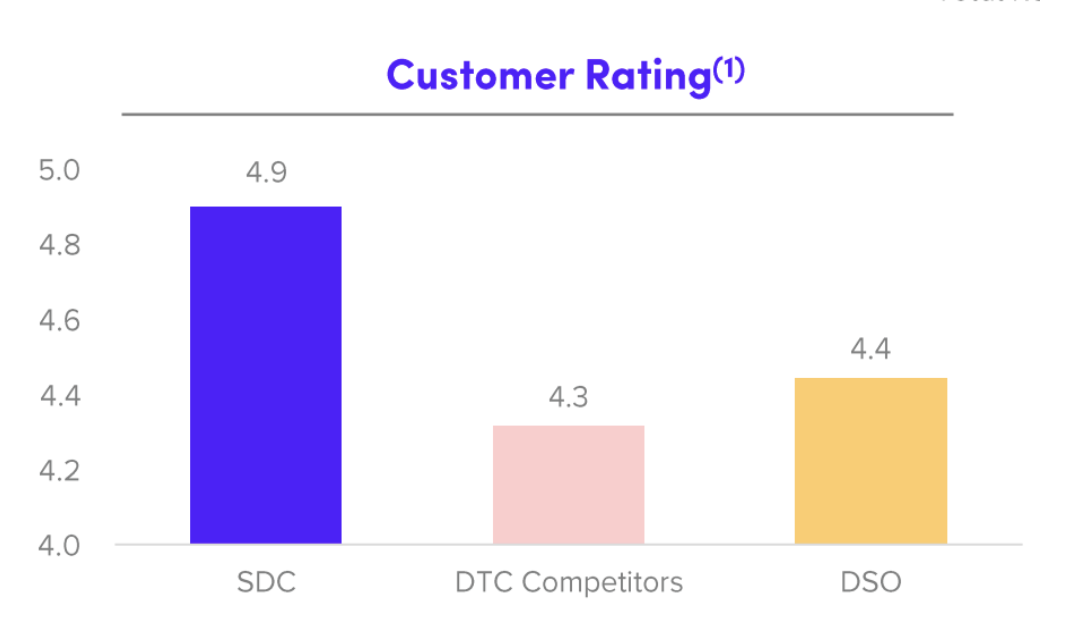
SDC’s stock took a dive for two main reasons. First, it disappointed investors with last quarter’s results, which were below guidance as the company could not keep up with demand in its manufacturing facilities. Secondly, the Coronavirus slammed most equities. SDC closed most of its stores worldwide, though anyone could still begin their treatment via their website. Last week, SmileDirectClub offered their 3D printing facilities to manufacture medical supplies for the Coronavirus crisis. Could a company with a 95% satisfaction rating of its plastic retainers live up to the arduous demands of Uncle Sam? Maybe. But when this virus too shall pass, SDC’s equity will begin to trade more like a promising growth story than a distressed plastics manufacturer.


GoPro: Capturing Distressed Action-camera Maker’s Comeback [SOLD]

By David Shakirov

Update 03/11/21: The author recommends disposing of this stock. GoPro saw a dramatic rise in its price from the pandemic lows of $2/share to highs of $12-13 in the aftermarket last month. At this price, GoPro is almost fairly valued. However, there are concerns over management’s ability to cut operating expenses to $250m as promised (the new guidance is $305-315m) and to minimize churn on their new GoPro + subscription service. GoPro could be a $15-20 stock, but given our gain of 130% and the foreseeable risks, Insight recommends readers to sell their shares. 

In 2002, Nick Woodman strapped a cheap plastic camera onto a wristband and shipped the homemade prototype to a manufacturer in China. Twelve years later, GoPro went public at  a $3B valuation, under the premise that everyone was in the market for its action cameras. Over the course of the next four years, GoPro failed to release new cameras, began pitching itself as a “media company” and manufactured a drone that turned into a commercial disaster. Its market value plunged from $90/share to $3.38 earlier this year.

Woodman (pictured above), a major shareholder in the company, began to reorganize the business back to its roots as a consumer electronics company. He cut corporate costs drastically (OpEx margin from 68% to 38%), banked on best-in-class high end products, and offered professional video tools for its users. GoPro plans to continue on this path by expanding its TAM (total addressable market) and top line by products like VR, while improving gross margins and settling into bottom line profitability. Even better, Nick Woodman spoke out recently and said that GoPro “crushed” the Black Friday + Cyber Monday shopping season, beating last year’s revenues by a whopping +120%, capturing 97% share of the action cam market.

GoPro’s main pitch to investors is its massive operating leverage stemming from growth opportunities over the next ~3 years. GoPro plans to (1) cut its operating expenditures from current levels (~$400-500M) to roughly $250M, (2) focus on growing ASPs dramatically with a focus on high-end cameras. (3) moving DTC to expand margins, and (4) banking on high margin recurring revenues from its GoPro Plus subscription service.

Let’s dive deeper into how these growth opportunities will continue to play out:

GoPro is huge on cost cutting — an initiative to run lean and create huge operating leverage. With operating costs of ~$400m/year, Nick Woodman announced he is cutting expenditures and headcount to manufacture roughly $150m of savings per year. If only half-baked and translated to $75m of profit at a low 10x P/E multiple, this initiative alone values GoPro above its current market value.

GoPro is focusing on high end (and high margin) cameras (like the Max, which retails at $499 vs. $299 for cheaper GoPros) which significantly increases ASP (average selling price). Even better, the demand for these higher end cameras is up 90% YoY, with cameras above $300 ASP representing 95% of sales. The new Hero 8, a high end offering, had 40% more first-month sales than any GoPro offering in history. Conservatively, if high-end cameras can improve GM by 500bp, that is roughly $60m of profit to be realized.

A shift to DTC (selling on GoPro.com instead of Walmart/Target/etc.) should expand profitability significantly, as well. The company mentioned that gross margins on the GoPro website are 500-1000bp higher (north of 40%). Selling directly on the website also improves cross-sell opportunities (e.g. GoPro Plus subscription, accessories, etc.) and improves data collection on what customers want and how they shop. The margin improvement alone, if achieved at the lowest bound, should bring roughly $50M of profit into the business.

GoPro is also expanding its their new subscription platform, GoPro Plus. Plus costs five bucks a month and gives users cloud storage and small discounts on accessories and cameras. It’s a high gross margin recurring revenue stream that builds loyalty. At the current rate, subscription numbers are growing at +20% quarter-on-quarter and GoPro is guiding $60-70m of recurring revenues from this service. At conservative 70% margin, this adds $40m of profit to the business.

That’s $225m of profitability if you’re keeping count.

Some other less quantifiable but still important catalysts —

(1) Potential of expanded TAM, by venturing into VR or other verticals. Woodman cites a magnified $13B TAM in GoPro’s future.

(2) Its brand name is a significant advantage. GoPro’s new products are backed by a reputation of “best-in-class”. More generally, consumers rarely “shop around” for action cams — they simply buy GoPro (which is why it captures 97% dollar share of the action cam market).

(3) Acquisition potential is notable, as well. Major tech companies are sitting on a pile of cash (like Apple’s $250B piggy bank, for instance. Buying a best in class tech hardware company like GoPro that makes sleek and sexy electronics might make some sense. Apple is reported to release a major piece of VR hardware in a few years, while Google just bought distressed consumer electronics company Fitbit. Even an LBO from management would not surprise me.

If we add all of the potential profitability as noted above, we can back into a $225m operating income business in just a few years. We are not even including the brand name, acquisition potential, or TAM expansion. By that hyper-conservative logic, GoPro, a premium consumer electronics and technology company is now trading at 3x 2022 EBIT. That’s right, a tech company at a 3x EBIT multiple. A bargain if there ever was one. Or, as Peter Lynch would say, a four-bagger home run.

Recommendation: BUY at the current price of $4.02

Auto Partner SA: Polish Auto Parts Apparently Boring, Yet Lucrative

By David Shakirov

The “hunt for value” in US equity markets is a tough one. High valuations and economic uncertainty are some of the barriers challenging investment managers in the United States, trimming alpha to zero (or, in some cases negative). Abroad, however, frontier and emerging economies offer higher growth potential at lower multiples. These opportunities are often overlooked for mostly irrational reasons, opening a whole field of study named the “Home Bias”. Since Williams Insight is in the business of offering our take on lucrative investments, this bias opens a window to do just that.

Here, I’ll cover “Auto Partner SA”, a Polish auto parts distributor that is a fast grower, trades at attractive valuations, and should reap considerable gains for investors even in conservative profitability outlooks. Founded in 1993, Auto Partner’s business focuses on selling auto parts for engines, transmissions, suspensions, lighting, etc. to mechanical shops around Europe, while taking advantage of an incredibly fragmented industry segment.

The Polish Backdrop 

 Auto Partner’s business is centered around Poland (its equity trades on the Warsaw Stock Exchange), although some of their operations are international in countries like Czechia, Austria, and Germany. The Polish economy, although relatively obscure to US retail investors, is one of the best localities for global investing. Poland, for instance, did not contract during the 2008 recession, and grew 5.1% in 2018. It has a population of 40m people, and is the largest economy in central/Eastern Europe. FTSE Russel had the conviction to upgrade it to “developed” last year (the first country to be upgraded in 10 years). From a regulatory standpoint, Poland is a stable nation — it is a member of the EU & NATO, and has an IFRS-compliant legal/financial system. Although it is relatively obscure for American investors, it does not have the political uncertainty that occupies most other fast-growing, off the beaten path economies. I challenge readers to identify any other with 5% GDP growth, attractive valuations, and a comprehensive legal/financial infrastructure.

Source: European Commission 

Auto Partner Business Model

The car parts business is not direct to consumer, but rather, entails distributing parts from manufacturers to auto shops. Auto Partner operates warehouses that allow it to ship parts from manufacturers to its customers (70% online, 29% in-store, 1% DTC), most of whom are mechanics.

Currently, the auto parts supplier market in Poland is incredibly fragmented — Auto Partner, one of the largest auto parts supply companies, has 7-8% market share. This gives Auto Partner an incredible advantage as it picks up “stranded” customers from auto parts suppliers that are smaller and go out of business. More speculatively, this fragmentation also provides M&A potential as private equity money is flowing into Poland at record levels.

Growth, Financials, and Valuation

Auto Partner’s business has been growing rapidly since its IPO in 2016. Here are a few highlights:

 +31% revenue (3 year compounded annual growth rate)

+43% EBITDA (3 year CAGR)

+53% Net Income (3 year CAGR)

Going forward, management guidance is targeting 20-25% top line growth and possibility for improving EBITDA margins.

Now, let’s model this out as a simply EV/EBITDA multiple to see how much equity upside there is…

 If we assume a conservative growth rate of 20% (2020), 20% (2021), and 15% (2022), and ignore the potential for improving EBITDA margin, we will observe the following EBITDA numbers…

Then, if we take the EBITDA numbers and apply 6x, 8x, and 10x multiples, after adjusting for net debt, we can arrive at the 2022 Equity Upside, as seen in the right-most column.

Although you can draw conclusions for yourselves, this model showcases that if Auto Partner can maintain the current 7% EBITDA margin, exhibits growth at or below management guidance (and significantly below the historical average), all while it’s EV/EBITDA multiple (which is currently 8x) compresses to 6x, there will still be 140% of equity upside in 2022 (which is 2.4x the initial investment, or 34% annual equity returns).

Recommendation: BUY at the current price of 4.33PLN

iPic: A Thriller

By David Shakirov

There was a time decades ago, when going to the movies was a spectacular affair. Forget cramped seats, with years-old popcorn stuck in-between its cheap, polyester cloth. Or the overpriced, low quality food offerings. Nowadays, the movie theatres themselves are normally wildly empty — industry insiders cite a capacity utilization rate in the teens %. No, this is not a piece on why, or how, Netflix became a $140B company. It is, however, a speculative tale of a theatre company trying to change an otherwise boring and slowly bleeding industry. What’s in its way? The Retirement System of Alabama, of course. That is, this article will try to explore the relationship between the RSA, a $44B pension fund, and iPic, a luxury dine-in movie theatre concept that found the wrong partner in its capital intensive crusade for selling movie-goers reclining chairs, martinis and lobster rolls.

In a 2015 interview, AMC’s CFO Craig Ramsey acknowledged that the industry is slowly suffering. He noted how movie theatres, unlike most other businesses, only operate at an 11% capacity, and how, by expanding and improving its seat offerings (and increasing the ticket prices), the number of attendees grew by close to 50%. It was years before Ramsey’s realization that Hamid Hashemi was slowly developing the luxury dine-in theatre concept. Out of this came “iPic”: a concept that rapidly decreased seats per square foot, expanded the size and comfort of each seat, increased the price 2-3x, and sold restaurant quality food and booze during the film screening. The business grew, opening locations across the nation in high end neighborhoods, throwing expensive, celebrity filled launch parties, and inviting “mixologists” and chefs to populate the kitchens. While AMC struggled with $460k of annual revenues per screen, iPic enjoyed $1.65m of per screen on its most luxurious offering

At a glance, iPic seems like a ripe growth story. Inorganically, iPic wants to grow via expansion. They operate 14 theatres, with plans for 43 by 2025, and over 250 in the long run. They also want to capture 13% of the Saudi movie market after acquiring rights to open there. Each opening is financed through a long term lease, with total debt reaching average levels of $11m/theatre. In year three, iPic sees roughly 25% unlevered free cash flow returns on a new theatre, enough to pay back debtholders, and hopefully, with scale, cover its cost of goods and corporate overhead.

Organic growth is major, as well. This year, iPic plans to revamp its movie theatres to include almost 100% high end seats (think not “premium” but “premium plus”). Why? Because it found that customers prefer the more expensive offerings 4:1 to the cheaper ones. iPic gets 60% higher ticket revenues from its already high-priced tickets, and patrons spend 80% more, on average, on food and booze (win-win). Also, it’s expanding the revenue stream to include other sources, including high end advertising revenues (given its target demographic), alternative theatre revenues (renting out theatres for gaming events, for instance), etc. Overall, it’s revenue per guest is up 25% since the beginning of 2015. Even with disruptions in its theatres (during renovations) and a slow movie market in general, iPic has seen a high teen revenue growth CAGR and a 10-12% store level EBITDA margin.

Actually, its store level numbers and gross margins looked pretty good. Its unlevered returns were not bad either (again, coming in at 25%). These were the statistics that management, on its investor presentations that have since been taken down, emphasized. What these numbers fail to highlight though, is the massive debt load of the company, and its toxic corporate overhead. These two have drawn the company deep into the red, at around -25% of revenues, bottom line. As iPic’s revenues swelled from $98m in 2015 to nearly $150m in 2018, its corporate overhead doubled, along with its “other expenses” (a line item for maintenance and miscellaneous costs). These two line items alone have continuously drawn the company into the negative, excluding the interest payments (15% of revenues) on its debt.

Maybe it’s the CEO/Founder/President/Chairman’s (all the same person) $5m pay package (with cash compensation actually increasing from 2017 to 2018 as the business bled harder and harder), or the company secretary’s $3.7 comp + equity. In total for 2018, the company cites $9.4m in relation to equity-based comp. I’m not attacking a system that incentivizes executives to perform through equity-pay, but raising the point given how much overhead the company sees (why not cut the pay in half, and given the company’s proposed and believable rapid growth, have the execs put their own cash into the stock? With the stock down 90% in one year, the equity-based incentive to operate the company efficiently did not work as planned…)

In the meanwhile, the Retirement System of Alabama (RSA) promised to fund this growing, capital intensive business. I bet they heard the same-store EBITDA and unlevered FCF pitch and drank the fruit punch. I know I did. Anyways, since 2010, the RSA has funded hundreds of millions of dollars worth of CapEx, store openings, and negative EBITs, while at the same time owning class B pre-IPO equity in the company. This has now converted into a 40% equity stake, in addition to owning all of iPic’s senior debt. Yep, the Retirement System of Alabama is practically fully in charge of a luxury dine in movie theatre concept.

The RSA, just like most investors, has likely had enough. In July of this year, the RSA has declined to allow iPic to draw $10m from its $190m credit line. Why did it need the $10m? To make an interest payment on its massive debt load to … none other than the RSA. The intention is clear. In their pre-IPO filing, iPic outlines its credit agreement with the RSA as follows:

“The remaining availability under the RSA Facility requires us to achieve certain operating targets before we may borrow.” (SEC/iPic)

Last week, iPic announced its Chapter 11 bankruptcy, likely after its operating targets were not achieved and the RSA declined to extend credit. Or, as they say in Alabama, iPic “just got too big for its britches”. After the filing, the RSA lent iPic a $16m debtor in possession loan to maintain daily operations.

The business itself seems to be growing and is profitable from a gross margin standpoint. If the RSA or management can find a way to pump the brakes on corporate overhead, there could be significant operating leverage within the firm, especially as it pushes to expand from 16 to 250 theatres.

I’ve been an iPic movie and restaurant goer myself since 2016 and the business’ value prop is crystal clear. If the company emerges from restructuring, whether or not it is owned by great state of Alabama, continues with its expansion strategy, and takes massive action to cut down its overhead, it will be an investment in my portfolio. Until then, I’ll grab my popcorn and watch from the sidelines (or one of iPic’s patent pending “pod” seats) as the drama unfolds…

—

Source for Mr. Ramsey’s interview from AMC:

https://celluloidjunkie.com/2015/01/14/daily-cinema-digest-wednesday-14-january-2015/

Other sources: SEC filings and company presentations

Fiat Chrysler — From Rags to Riches [Sold]

By David Shakirov

UPDATE 11/4/2019: As of 11/4/2019, the author recommends to sell FCAU.

Even after a capital gain of 17%, from $13.78 (5/28/19 closing price) to $16.14, today, the stock continues to trade at a compressed EBITDA multiple. Unlike its competitors, FCAU runs net cash, and will likely see margin expansion as it offers higher end vehicles like the Alfa Romeo CUV, electric Maserati, and a new three row luxury Jeep. This quarter, FCAU was able to increase adj. EBIT, even as revenues and volumes shrunk (which is even more impressive with a ~15% gross margin business).

However, two issues make the investment questionable. First, holding an auto maker late cycle can prove to be dangerous. Second, the merger between FCAU and Peugeot is a source of significant uncertainty. It becomes increasingly difficult to evaluate the synergies between the two auto makers, and the benefits of such a transaction. A sell will book a 17% gain for our readers (or 7% above the S&P 500).

\\\——————————————————————————————————————————///

In the late 2000’s the American car market was in shambles. Companies including Chrysler and General Motors were pushed into bankruptcy and provided a lifeline by the federal government. Coming out of bankruptcy in 2009, Chrysler was a financially distressed corporation trying to manufacture $20,000 vehicles during the worst financial crisis since the Great Depression — what I call a hard sell. In the meanwhile, Fiat, a small Italian car marker saw an opportunity. Sergio Marchionne, the CEO of Fiat at the time (and known to be a espresso-holic and chain smoker), began expanding his stake — 20% in 2009, to 53% in 2011, and a 100% acquisition in 2014. The result  — Fiat Chrysler Automobiles N.V. (FCA).

Following the merger, FCA’s vehicle portfolio turned to be incredibly diverse and highly valuable. It included brands like Ferrari, Maserati, and Alfa Romeo (the Italian three musketeers), Chrysler (built Detroit-tough), Jeep (the legendary off-roader), and Dodge (true American muscle). FCA continues to make vehicles from minivans to Italian sports cars. Since then, its brands have seen immense growth (Maserati volumes increased 8x, its Ram trucks saw 8 years of consecutive growth, Alfa Romeo sales up by 2.6x, Jeep sales doubled, etc). Only 10 years ago, the company was in financial ruin and faced near-death.

Its 2022 master plan was unveiled last summer (one month before its CEO, Sergio, passed away) at a sentimental event celebrating the FCA success story. Its goals (and my subsequent take) include :

  • $10B investment in electric tech

    • FCA recently spent over $2B to buy emissions “credits” from Tesla to meet strict carbon-laws FOR 2020 — electrification tech is important to keep emissions low

  • Partnership with Google’s Waymo and BMW’s Aptiv for autonomous driving

    • Unlike other companies, this partnership is less capital intensive. With Waymo, FCA will provide ~60,000 Chrysler minivans for testing, while it shares resources, data, and testing with BMW

  • Maserati volumes double to 100,000 (double from 2018) and margins increase to 15% (13.8% in 2018)

    • Maserati is moving to compete with the German’s high end offerings, while its current demographic is both 5-10 years younger and has a 2x average income (there is both potential to tap into the high-mid income bracket, plus offer higher end options, all to longer-lasting customers than the competition)

  • Ram is increasing its high end truck offerings to increase its ASP

    • The brand is seeking double digit YoY volume growth and lags by $5-10k behind competitors in ASP ($50,000 vs. $56,000 for Ford, for example). Given strong loyalty data, new high end offerings should increase revenues significantly. There is also untapped potential in the Asian markets with the Ram brand

  • Expansion of Jeep as a mainstream SUV brand, with a focus on electrification

    • Historically, Jeep had an image of a tough, military off roader. Now, it sells 1 in every 17 SUVs, while it expanded production capacity by 2.4x over the last four years. With SUVs constituting most car purchases in the US, it’s natural to expand into this market. By 2022, Jeep sees industry-wide utility sales (UVs) move from 32M to 37M, and has a long term goal of 20% UV market share. It will also introduce 4 dedicated electric UV models.

  • 1.75x EBIT growth, margin increase from 6.8% to 10%, cash increase from $12B to $20B

    • Growth prospects both geographically and within each FCA brand, platform and fixed cost sharing, and its increasing net cash position should improve the company’s already positive financial situation. This may result in dividend increases (current dividend yield is 4-5%).

FCA is a growth story in an otherwise lackluster, high-fixed cost industry. It currently trades at a 7x P/E (17x industry average) and is faced with little debt (0.15 debt/assets). FCAU even trades on a 0.15 PEG. In the case of a recession, the company is well positioned financially, and in terms of product offerings, to weather the tough environment. Aside from its net cash position, it also only put up 10% of its PP&E as debt collateral, and has access to a $7B credit facility (historically stable liquidity at $20B, or 2x annual SG&A + R&D). Given the economic expansion continues, however, the company has incredible growth potential — it will continue to develop its diversified product offerings and push its untapped geographical penetration in China and LatAm, for example. Its 4.5% dividends can also provide a cushion in the case of minor capital losses.

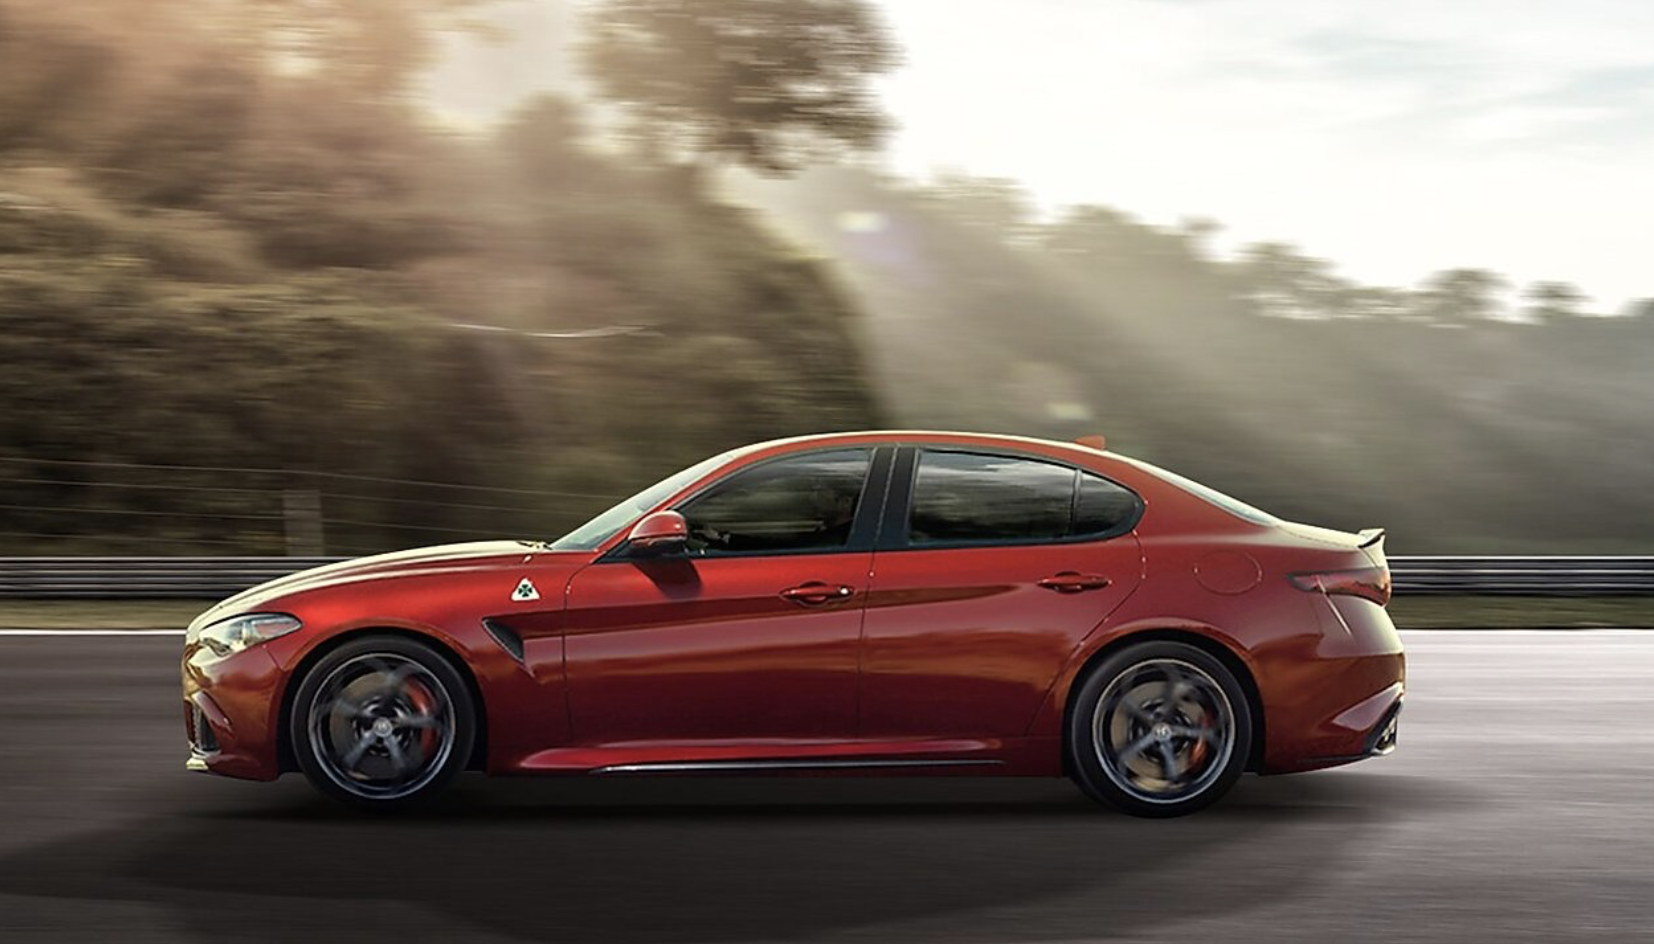
During the development of this article, I was given an opportunity to drive Alfa Romeo’s flagship sedan, the Giulia (first image) — a four door Italian rebuff of the German status quo. Why the Ramsey Alfa Romeo dealer trusted me with a $50,000 stallion is beyond the point — the vehicle drove on rails, a crystal clear step above your neighbor’s vanilla Benz. As I carved through North Jersey’s twisting and turning roads, I realized the Alfa (mind you, this is the “regular” Giulia, not the $80,000 sports version) went through near-hairpin turns at 40mph. If my anecdote is any reflection of the future, then FCA’s looks bright.

Regardless, who doesn’t want a vehicle built Detroit-tough, but with a hint of Italian love?

Recommendation: BUY at the current price of $13.78 (see updated at article header)

Ferrari — How Much is a Prancing Horse Really Worth? [Sold]

By David Shakirov

UPDATE (6/13/19): the author recommends selling Ferrari stock. Currently, shares trade near $160. Given Ferrari’s guidance for 2022, the stock is trading at a 30x P/E on those numbers, or a 50x+ P/E on today’s figures.  Macroeconomic headwinds may still push down its equity price in the next 12-18mo, though Ferrari NV’s underlying business will likely not be impacted as severely as most corporations.

Insight readers will book considerable capital gains: since the article’s publishing just 5 months prior, Ferrari stock has climbed 40%, or 31.2% above the S&P 500. 

\\\—————————————————————————————————///

In my last article, I spoke about Ford — an international behemoth with revenues of $150B+, low margins, distressed investor sentiment, and production numbers of over 6 million cars per year. Ferrari is also a car company, is publicly traded on the NYSE, and starts with the letter “F”. That’s where the similarities end.

Here’s why Ferrari is so interesting — unlike traditional car companies, Ferrari has immense control over its top line and customers. More specifically, Ferrari admits to limiting production of its vehicles significantly below demand to enforce an aura of exclusivity, luxury, and brand image. The latter, Ferrari admits, is crucial to its business. However, how can a publicly traded company answer to Wall Street’s insatiable appetite for GROWTH? Ferrari’s medium-term solution is to grow its product lines (sports cars, GTs, and Purosangue, or SUV) and expand its demand base significantly, while growing supply at a meager 7-8% per year. In this way, Ferrari essentially controls their top line in the short run. The longer run issue, however, is when will its production finally reach demand, forcing the company to lower prices or lose its brand image? Ferrari’s current

valuation has limited medium term upside (more on this later), but investors may be interested in three factors — high dividend potential (when the company matures in the mid-late 2020s), international growth (in EMs, China, and LatAm), and nearly universal brand value and name recognition.

The relationship between Ferrari and its customers is highly unique. Of its car sales, 65% are to existing Ferrari owners while around 30% are to owners with at least 2 Ferraris. To be “allowed” to buy one, prospective clients are often screened by their devotion to the brand through Ferrari fan-clubs, general passion for the vehicles, financial standing, and other unknown factors. Owning a used Ferrari also helps. Then, customers ate pushed to buy the entry-level variants (such as the California or Portofino). This, combined with its undersupply strategy, could position the company to weather a recession incredibly well— they control who buys the cars, and tons of clients want them! In 2008, when Ferrari was not as prominent in LatAm, EM, China, etc. and did not offer as wide of a lineup, its auto sales slumped 10% (while the luxury performance auto market shrunk in half).

It is possible that in a mild recession, Ferrari’s production may continue to rise as even recessionary demand for its prancing horse declines, given the significant gap between supply and demand.

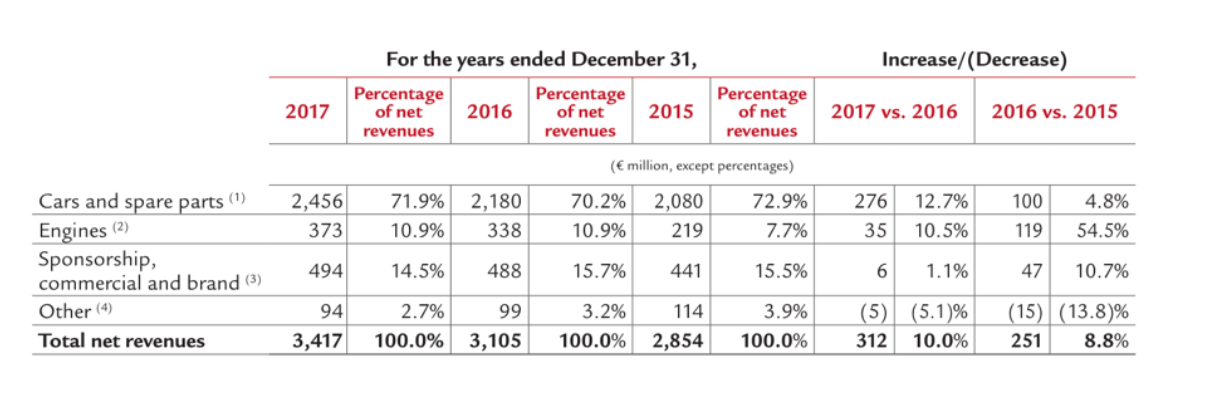
Although Ferrari is known for its car production business, this only accounts for 72% of revenues. Another 11% is engine production for Maserati (which accounts for ~80% of Ferrari’s total engine production, with the rest for Ferrari vehicles). Another 15% percent is purely based on its brand — licensing and distribution fees from selling Ferrari merchandise (think hats, shirts, and Legos), Ferrari World Abu Dhabi, and other brand-related revenues. Capital-wise, Ferrari took advantage of low rates (bonds with 25bp coupons) and secured a number of large bond offerings (it has 1.8B Euros of debt on the balance sheet, and runs net debt). Given its high margins, ability to refinance, and strong top/bottom line growth, the debt likely does not pose a significant risk to the business.

There are other important risks, however. First, international emissions regulations are pushing Ferrari into two directions. The brand could either keep buying emissions credits (by paying “clean” companies like Tesla, given Ferrari’s twelve-cylinder gas-guzzling sports cars) or begin improving efficiency. The latter strategy, which is realistic into the future, would involve hybrid motors and electrification (both of which Ferrari is trying to avoid as to not damage its brand reputation for gas-motor sports cars). Ferrari promises that in the next 3-4 years, 60% of its lineup will encompass hybrid tech and that these models will stay true to their Italian high-performance roots. Competitive risks also exist, from brands like Lamborghini, Aston Martin, Bentley, and Rolls Royce. Most of the competition is also backed by larger auto companies (Volkswagen Group in the case of Bentley and Lamborghini, BMW for Rolls Royce, etc.), which Ferrari had until its spin off and IPO in 2014. The benefits of this include better bargaining power, platform sharing, lower costs, etc. (for example, the new Lambo SUV is on the same platform as Audi’s Q7, also owned by Volkswagen). Additionally, given that 77% of Ferrari’s sales are of its lower-end V8-engine cars (which have an MSRP of $200-300,000), competition at these price points is higher. This may further discount the value of the Ferrari brand, as clients may be inclined to purchase competitive vehicles (either for lower-price or better quality). As Ferrari increases its production numbers beyond competitors due to its publicly-traded nature, it may also lose its exclusivity and touch with customers (this may not be an issue, however, if the company expands into different categories like hybrids and SUVs).

Through a DCF, I considered three cases — a base case ($116 target) where company guidance through 2022 is generally met (see the “Key Financial Targets” table), a bear case ($97 target) which includes a recession, and a bull case ($127 target) where company guidance is generally met two years early. The base case assumes a 4.7% annual growth rate of the core vehicle business (based on the CARG of the last 5 years), a 10% annual increase in Maserati’s engine demand (based on Maserati’s growth goals), and a 3% annual increase in the sponsorship arm (conservative growth). The bull case assumes the same 4.7% growth rate (since a “bull” scenario does not mean more production, given Ferrari’s exclusivity model) of the core business, but a stronger 20% y/y growth of the Maserati engine business, and slightly higher growth for the sponsorship business (somewhat conservative 5% per annum). Finally, the bear case assumes zero growth for the core business (not a decline, however, since Ferrari’s market is quite undersupplied), a 25% decline in Maserati’s business (based on luxury auto market behavior in 2008 from competitors like Mercedes/BMW), and a 20% decline in sponsorship (given a 15% decline in retail sales in 2008).

As you can see for yourself, there is not much upside or downside in the stock. However, given that they directly control around 70% of their top line results by controlling supply, the company’s performance has little downside in a recession. The short to medium term upside, however, is weak as well. Maybe I should have written this article two years ago, when Ferrari was trading at $40 (and not $110!) and had similar fundamentals. If you already own the stock (and don’t want to realize your gains for tax purposes), or are looking to invest longer term, there are a number of reasons to stay in. First, the company promises to buy back ~10% of its market cap over the next 2-3 years, has long term growth opportunities in markets like LatAm, China (where they sold only 617 cars in 2017), and other EMs, especially if it will expand its line-up to include hybrids and SUV-like vehicles. Its incredible brand value doesn’t hurt as well, while the prospect of a cash-cow business opens up the opportunity for high dividends (which are strongly considered by management for before 2022).

Overall, Ferrari is an exciting company. Unlike most car companies, it has immense control over its customers and makes exciting products. I live only a couple miles away from Ferrari’s North American headquarters and had a chance to chat with some of their engineers. One told me that Ferrari’s engineering and designing prowess (in terms of features and reliability) has improved drastically from just 3-4 years prior. Surprisingly, only two years ago, most car journalists weren’t excited about Ferrari’s vehicles and presumed that the company was relying too much on their brand to sell their cars. As a car enthusiast, I checked out the new Portofino, 812 Superfast, and some of their future offerings — Ferrari has massively stepped up products. The auto world agrees.

And who knows, maybe by buying Ferrari stock for growth you’ll be able to purchase one of their heart-stopping, pants-dropping cars down the road. If they’ll let you, that is.

Ford: Buy for the Value, Keep for the Dividend [Sold]

In my last article, I mentioned that tech is not the love-child of the markets anymore. If Apple is no longer “hot”, then neither is a 115-year-old American car company. I’m referring to Ford — at one point the pride of American innovation, manufacturing, and design, and now a company struggling to find their forte in the evolving car business. Investors look to sexy electric vehicle manufacturers that produce models with self-driving capabilities and gut-wrenching acceleration (ahem, TSLA). The newest 2019 Ford mom-van, unfortunately, may not hit those marks. Kidding aside, Ford’s stock (F) has suffered since 2014 — not a fun ride for those aboard. Since its $17 peak, Ford has hit bottom, as of this article’s writing, at $8.02 — a 55% price decline over 4 years (the S&P 500 has climbed nearly 30%). Investors point to an uninspired focus on autonomous driving technologies as competitors ramp up efforts in self-driving tech. International demand, especially in China (18% of business, by units), is also a concern for investors — President Trump’s tariff disagreements are not helping (however, Ford’s largest market is the United States). Contrary to investor sentiment, however, Ford is investing heavily in self-driving tech, maintains a healthy cash position, grows revenues, and pays a 7% dividend (which has been reiterated as recession-proof by management). When Ford is mentioned throughout this article, the term refers to the Ford brand, in addition to its F-series, transit van, Ford Credit, and Lincoln businesses.

Ford’s international exposure is a major concern for investors. Although revenues in all but Ford’s smallest region (Africa/Middle East) have either increased or stayed flat over the last two years (this includes Asia, Europe, South America, and North America), market share is a different story. Ford’s share in all of its regions has decreased slightly (e.g. 14% to 13.9% in North America, 9.6% to 8.9% in South America, and 3.6% to 3.4% in Asia). Given that overall sales volume was in better shape, while Ford’s market share deteriorated, a highly-competitive environment may be cited. Competition from other American brands (including GM’s Chevy/Cadillac unit, FCA’s Jeep, Dodge, Ram, and Chrysler units, and yes, Tesla) or Asian companies (i.e. Honda/Acura, Toyota/Lexus, Kia/Hyundai/Genesis) may be problematic. As a bit of car-geek myself, it’s hard to make a case for most of Ford’s models over competitors— the “Taurus” has not been refreshed for 9 years, the “Fusion” has looked the same for the last 6, while the “Flex” reminds me of a refrigerator.

Ford has two major issues with its models — an aging line-up and lack of autonomous tech. First, Ford is moving to change its model line-up entirely. It announced earlier this year that all non-SUV/truck models (minus the legendary “Mustang”) will be on their way out in North America soon, to reflect consumer preferences toward the SUV. By 2020, the company promises to reallocate $7B from sedans to SUVs, while introducing eight new or refreshed models. Ford’s existing SUV’s are all receiving refreshes either this or next year, including a sporty “Edge” (think Mustang-powered mom-van), and a full-size SUV from Lincoln that blows Cadillac’s Escalade, or its largest competitor, out of the water. The F-series pick-up truck (which is America’s best selling vehicle by volume) has recently received a major overhaul, and a brand new “Explorer” is coming out January 9th. A separate Mustang-SUV model is also in the works. Ford also continues to focus on providing electrified options for its vehicles, and promises to sell more hybrids than Toyota by 2021, although this may be a lofty goal. Given that margins on larger vehicles are often thicker as well, bottom line numbers may improve during this transformation.

Over the last 3 years, however, Ford has made a mistake by delaying its autonomous unit. While Tesla claims some of its models are already equipped to handle self-driving software, competitors like GM have raised billions for their self-driving units and promise results by the end of 2019. Ford, on the other hand, has joined the race this July and promises driverless vehicles by 2021 by creating its own unit, “Ford Autonomous Vehicles LLC”, and attracting outside investors. A two year difference seems major, but really isn’t — even if GM or Tesla release driverless models (referred to as Level 5 or 6 autonomous vehicles) by the end of next year, the adoption rates by consumers and legislative challenges will be major. Here’s a worrisome study — the percentage of people who said they would not trust a self driving vehicle increased from 40% in 2016 to 48% in 2017. As of this week, Congress also pushed autonomous vehicle legislation into 2019, a disappointing move to companies that hoped to begin testing on more public roads. Regardless of when self driving tech becomes fully developed (or legally permitted), most consumers are currently satisfied with blind-spot monitors and collision warning systems in their vehicles, although the landscape may change by 2021.


Financially, being 115 years old may be “boring”, but it certainly helps the piggy-bank. Ford’s short term liquidity (cash + short term investments) is substantial — $39B in 2017 (an $2.5B increase from 2014), while shareholder equity is $35B (an $11B increase from 2014) at a $30B valuation. GM, its direct competitor, has seen declining equity (to $35B, as well), cash and S/T investment levels 40% lower than Ford’s, a lower dividend yield, yet a higher ($40B) valuation. Furthermore, its price/sales and price/book are both lower than GM’s (40% and 32% lower, respectively). Between the two main American automotive manufacturers, Ford may trade at a more attractive valuation. To take advantage of its strong cash position, Ford has also boosted its R&D spending by 20% over the last 3 years to develop its self-driving unit and, with increasing top line and stable bottom line results, can afford to do so.

Ford Credit, and Ford’s pension liabilities may be concerns for some investors. The former provides leasing and financing tools for Ford customers, and is affected by unexpected events (i.e. repos, defaults, etc.). Over the last two years, however, this business has been stable (with mid-700 FICOs and stagnant repo rates). Ford also maintains a stable amount of reserves (0.43-0.44% of receivables) for its credit business. In terms of pension liabilities, Ford currently has a ~90% funded pension. This amounts to a $8B gap in funding, a small amount relative to Ford’s cash/short term liquidity.

Here’s the really exciting part — its 7.5% dividend, consistently paid over the last 3 years. The dividend costs Ford a touch above $2B per year, and, according to its CFO, will perpetuate in the case of a recession. This is not unlikely, given the company’s cash position and extensive credit lines. For long-term investors, whatever room is left on the downside may be cushioned through a $0.15/share quarterly “pillow” and may provide consistent fixed income even during an economic downturn over the next few years. Can we really trust Ford’s management on maintaining the dividend? On average, car sales by units in the US fall 17% during economic downturns (given data over the last 3 recessions). If Ford’s revenues decline 17% in a downturn, their bottom line would decrease by $2.9B (given a net profit margin of -11%, as it was observed in 2008). Hence, even if Ford declines 1:1 with the auto market (which, assuming Ford’s vehicles are revamped over the next few years and become more attractive than the average, may not hold true), Ford’s bottom line would decline to $4.6B, while operational free cash flows would fall 16% to $13.5B, well above the $2.5B yearly expenditure on dividends Given the fall in FCFs, we would expect the net change in cash to turn negative (-$2.4B), given data from the last 5 years. Ford’s cash/cash equivalent position sits at $40B — a cushion large enough to absorb an economic downturn seen in 2008 (even though the next downturn will most likely be less severe).

The stock has hit (as of writing) last month’s 9 year low. Given this, plus a sub-30 RSI, it is highly likely to bounce up from this level. In late January, Ford’s quarterly report is due and may be a catalyst for an upward move if it beats its cited key metrics (including profitmargins and EBIT). More importantly, its transparency about future plans in regard to autonomous vehicles or a turnaround may spur positive sentiment.

In terms of valuation, a conservative DCF scenario yields $10.50-$11 (35% upside, not including the dividend). This factors in ~10% increases in market share (i.e. 7% share to 7.7% share in Europe) due to a more competitive model lineup and a ~4% decreases in prices (either to undercut competitors, increase demand, etc.) across all regions.

My opinion, however, is that a model is not as applicable in this case as in others. More specifically, the industry will change dramatically in the next 5 years and modeling may fail to take this into account — the best analysis should consider both company fundamentals and management. The right C-suite is an incredibly important factor in a turnaround like Ford’s.

Ford’s executive team, including the CEO, are taking calculated steps in this overhaul. The CEO seems hesitant to unveil any “master plan” and does not consider himself a “savior” for the company — data show a “loud” turnaround almost always leads to an undesirable outcome (see researcher Jim Collins’s published studies for more info). Rather, Ford is facing the “brutal truth” by cutting its losers (sedans), revamping/improving its winners (pick ups, SUVs, and the Mustang), while keeping company financials healthy. Critics point to James Hackett’s (Ford’s CEO) lack of experience in the automotive world, but this is irrelevant — data shows great leaders possess a universal set of skills, like humility, will, and a work-horse attitude, while technical skills are learned quickly (this is why students attend liberal arts schools like Williams, by the way). Hackett admits in interviews he does not have a grand vision, but is simply comprehensively assessing Ford’s and the industry’s trends to arrive at the best decisions to drive the company forward. To be frank, Hackett could easily go on CNBC with an energized message to bring Ford “back from boring”, land on the cover of Fortune or Bloomberg Businessweek, setting its stock on a potential bullish run. As someone who owns nearly 150,000 shares of Ford stock, there is definitely a reason he has not done this already. Although the findings in this paragraph may seem highly qualitative, they are deeply rooted in data and case studies of hundreds of American corporations (see published works Good to Great and How the Mighty Fall for more information).

There is little doubt Ford is currently a “boring” company. This, however, doesn’t have to mean a “boring” investment. Ford’s turnaround is likely to be successful and, given their dividend and financial position, time is on their side. If all goes according to plan, Ford’s vehicles and technology will be almost entirely revamped by 2021, while history and data point to current leadership being a positive catalyst during the transition. Given a long term view, we can expect at least 50-55% upside over the next 4 years (via the DCF model and dividend yield). In addition, Ford’s stock can be an effective hedge against a downturn with its dividend. Maybe investing in Ford is not “chic” to bring up in a conversation with your millenial friend, but who really cares when it makes you money?

Micron: Finally A Value Stock? [Sold]

By David Shakirov


UPDATE 03/21/2019: After a rise in the stock after earnings on 03/21/2019, I recommend to unload shares at $43.50, booking a 27.5% gain. An uncertain semiconductor supply/demand dynamic and higher valuation results in a more subpar risk/reward ratio. However, the gain booked from this article is an impressive 15% above the S&P 500, for a total gain of 27.53%.


Tech stocks are no longer the loud, hard partying rock and roll band of the equity markets. Although the S&P 500 has declined 10-11% over the last three months, the technology sector is trending lower (the NASDAQ 100 is down 14% in the last 3 months). At one point a sweetheart of momentum investors, AAPL, for instance, is spurring a love-hate relationship with its shareholders with lowered transparency, demand issues, and a 30% decline in its share price. Micron (MU), however, is even more extreme.

An American chip-maker based in Idaho, Micron is in the memory-supply business, including RAM, solid state, flash drives, etc. — a key component of most electronic devices. Micron tailors memory products to customer specifications, and sells through either online or in-person sales representatives. Approximately half of its net sales stem from its ten largest customers including Oracle, GE, Google, and Cisco — major players in the cloud computing, networking, and analytics businesses. To make its memory chips, MU relies on a small number of Chinese suppliers for raw materials (including silicone, chemicals, rare-earth metals, etc.), while 88% of its orders originate outside the United States — making its business model vulnerable to tariffs, shortages, or transportation mishaps.

Since mid-2016, however, RAM prices and demand have skyrocketed, which may account for Micron’s revenue growth from $12.4B (FY2016) to $30.4B (2018).  Its stock gained strong momentum, lifting from its sub-$10 low to a high of $60 over two years as analysts cited the company as “generating increasing profits” (Benchmark) and pointed to its attractive valuation (Wells Fargo).

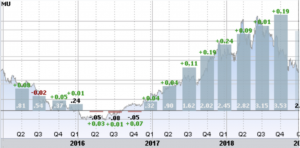
After underperformance in 2016, Micron’s Earnings Per Share have been steadily increasing for the past two years (grey bars), beating analyst expectations for 8 straight quarters (green figures). Source: E-Trade 

Since late-May, MU has declined almost 50% to $33 as analysts began to see cracks in RAM pricing and demand, an attack on Micron’s core business. Analysts focused on declining EBITDA given the weakness in its business environment. However, firms like Moody’s have reiterated that, for example, debt-to-EBITDA will continue to be sub-1 while RAM pricing is simply a cyclical (not structural) downturn.

The PHLX Semiconductor Index (SOX), a metric cited by MU’s 10-K as an accurate measure of the semiconductor market, has trailed 15% down from its peak in late May. Some of Micron’s largest competitors, including SK Hynix, have trailed down 35% (compared to Micron’s 50% drop). Given that these companies operate in the same memory-business, Micron seems to be hit hardest by the cyclical decline in prices.

Although it faces a more difficult than expected business environment, MU may now trade at an attractive valuation. Since 2016, it has paid down debt (from $12B to $11B) while doubling assets (from $22.5B to $43B) and nearly tripling revenues.  Its short term liquidity is not concerning (current ratio of 2.8x) while its debt profile is quite small (debt/equity of 0.14x). Operating income, a large focus for MU investors, has increased from $13.3B in 2014 to $15.8B in 2018. These metrics point to a strong balance sheet position and rising revenues/income. Investors are more focused on the cyclical decline in the memory-business, however, and not company fundamentals..

Given its healthy financials, the memory business landscape is a catalyst for the stock. M As competition between MU and its competitors (including Samsung and Chinese firms such as SK Hynix ) intensifies, fears of oversupply and hence memory price deflation emerge. Micron admits that the Chinese government’s direct investment into Chinese semiconductor companies poses a competitive (and possibly “unfair”) risk. Nevertheless, Micron has close to $7B of cash to spend on R&D — a significant moat for its competitive advantage, given it only spent $2.8B on research and development in 2018. Given the tough semiconductor/memory environment and tough competition, it may make sense for MU to increase its R&D expenses to protect itself even further. ? Demand, however, should grow as the development of virtual reality, cloud storage, and machine learning expand, as Micron provides a significant amount of product for these memory-reliant industries. Investors, however, seem more worried about cyclical changes in memory pricing, rather than long term sustained growth in demand.

Even if we modeled a 10% decrease in memory prices, a stagnant market share, poor worldwide RAM demand (15% total growth from 2018 to 2025), and flat margins, we would still expect a $45 price target on the stock (given a discounted cash flow analysis, performed by Trefis).. This case incorporates very conservative inputs. A more realistic case, however, incorporates declining memory prices, a continued trend of increasing market share (given rising R&D investments from its strong cash position) at slower rates to 40% in 2025 (from 35% in 2018), and 20% total growth in the DRAM market until 2025. This points to a price target of $60, or 80% upside from its $33 price.

Micron will be announcing earnings after the bell on December 18th. If it addresses the state of its business environment — the memory market — by either pointing to improvements in the market or MU’s adaptation to the price/demand pitfalls, investors may feel relieved. Rather than focusing on the short term cyclical pricing of memory, value investors should use MU as a cheap vehicle to profit from the expanding memory market. Micron’s stock price is like a loaded slingshot, pointed up. With little downside left after a 50% decline and a catalyst earnings call, it would be hard for a disappointing news to depress the stock even more. As the third largest player in a market that naturally expands with the growth of technology, in addition to a prime financial position and an oversold price (with an RSI of 40) investors should find peace in the $45-50 range within the next 6 months.