MGM Resorts International: The Right Bet?

By Drake Mead

Recent Shifts in the Gambling Industry 

In 2018, the state of New Jersey won a landmark supreme court case, Murphy v. National Collegiate Athletic Association (initially Christie v. NCAA, but the case was renamed after Phil Murphy was elected governor). This case struck down the Professional and Amateur Sports Protection Act of 1992, which had basically given the state of Nevada a monopoly on sports gambling, and more importantly from the standpoint of gambling companies, limited their operations to the state of Nevada. This development caused the gambling industry to explode in New Jersey. By May 2019, only 11 months after the legalization of sports wagering in the state, New Jersey sportsbooks took in more in monthly wagers ($318.9 million) than Nevada ($318.3 million), and NJ repeated the feat in in July, taking in $251 million versus $235 million in wagers in Nevada. Note that the month-to-month change in wagers is not due to a slowdown in the industry, but rather because May is a much more active month sports-wise than July, with the NBA and NHL playoffs occurring. Multiple other states have legalized or are in the process of legalizing sports betting. Indeed, according to Morgan Stanley estimates, the legal sports gambling business will generate $7 billion in revenue by 2025, compared to $833 million this year, a 740% increase. That’s up from their $5 billion estimate last year, and in the (admittedly unrealistic) case that every state has legalized sports wagering by 2025, they estimate the industry will generate $15 billion. Clearly, due to legal changes, this industry is primed to explode.

Asset Light: A New, Innovative Strategy

Out of all the different firms vying for a piece of this proverbial sports wagering pie, MGM Resorts International (NYSE: MGM) stands out for their new, forward looking strategy and business deals they are taking to corner the market. MGM, sensing which way the wind is blowing, is currently implementing a strategy to make their company more “asset light,” reduce debt, and return capital to shareholders. This strategy in the long run will make the firm more flexible, and give them the cash to better break into the market in new states as they legalize sports wagering. This has manifested itself twice recently, first on October 15, when MGM agreed to sell two of its properties in Las Vegas, Circus Circus and Bellagio, for $4.3 billion, and again on January 15, when they agreed to sell MGM Grand and Mandalay Bay for $4.6 billion. They will continue to lease and operate the latter three properties. All of the properties were relatively old; all of them were at least 20 years old, and Circus Circus was opened in 1968). This transactions will also more than octuple MGM’s cash on-hand, from $1.23 billion (As of September 30, 2019) to about $10.1 billion before tax and transaction costs. This will be useful as they expand into new opportunities in online gambling.

MGM and the New Reality of Sports Gambling

MGM is quickly moving to increase its market share in new sports betting opportunities. In New Jersey, MGM holds an 8% market share in sports wagering among casino-operating firms. Although this number might seem low, that’s in part because sports gambling in NJ has historically been dominated by Resorts AC, the oldest and most famous Atlantic City Casino. In states other than NJ where MGM is a more recognizable brand than Resorts, MGM will likely be able to get a larger market share.

MGM is also actively moving to increase their market share in the online sports gambling industry. On October 29, MGM and Yahoo Sports announced an official partnership deal for BetMGM, MGM’s online sportsbook, to be integrated into the Yahoo Sports platform. This will come in the form of the ability to place wagers on games directly in the Yahoo sports app, and later on will involve “fantasy-style” gambling that is compatible with Yahoo’s already popular fantasy sports platform. This partnership with Yahoo will greatly increase BetMGM’s exposure to new, potential gamblers, increase accessibility to wagering, and grow revenues as it attracts more people to gambling. Additionally, MGM announced a partnership with Buffalo Wild Wings, the largest sports bar chain in America with over 1,200 locations, in September. This partnership currently includes BetMGM spreads and gaming information being displayed at the bar, and BetMGM is currently testing a program in NJ of giving some exclusive perks to those who use the MGM app inside the bar.  Although they did stop short of turning every Buffalo Wild Wings in America into a sportsbook, this will help increase BetMGM’s name recognition and increase revenues and market share directly by incentivizing bar-goers to use MGM’s platform.

Financials (All numbers in millions, except for valuation multiples)
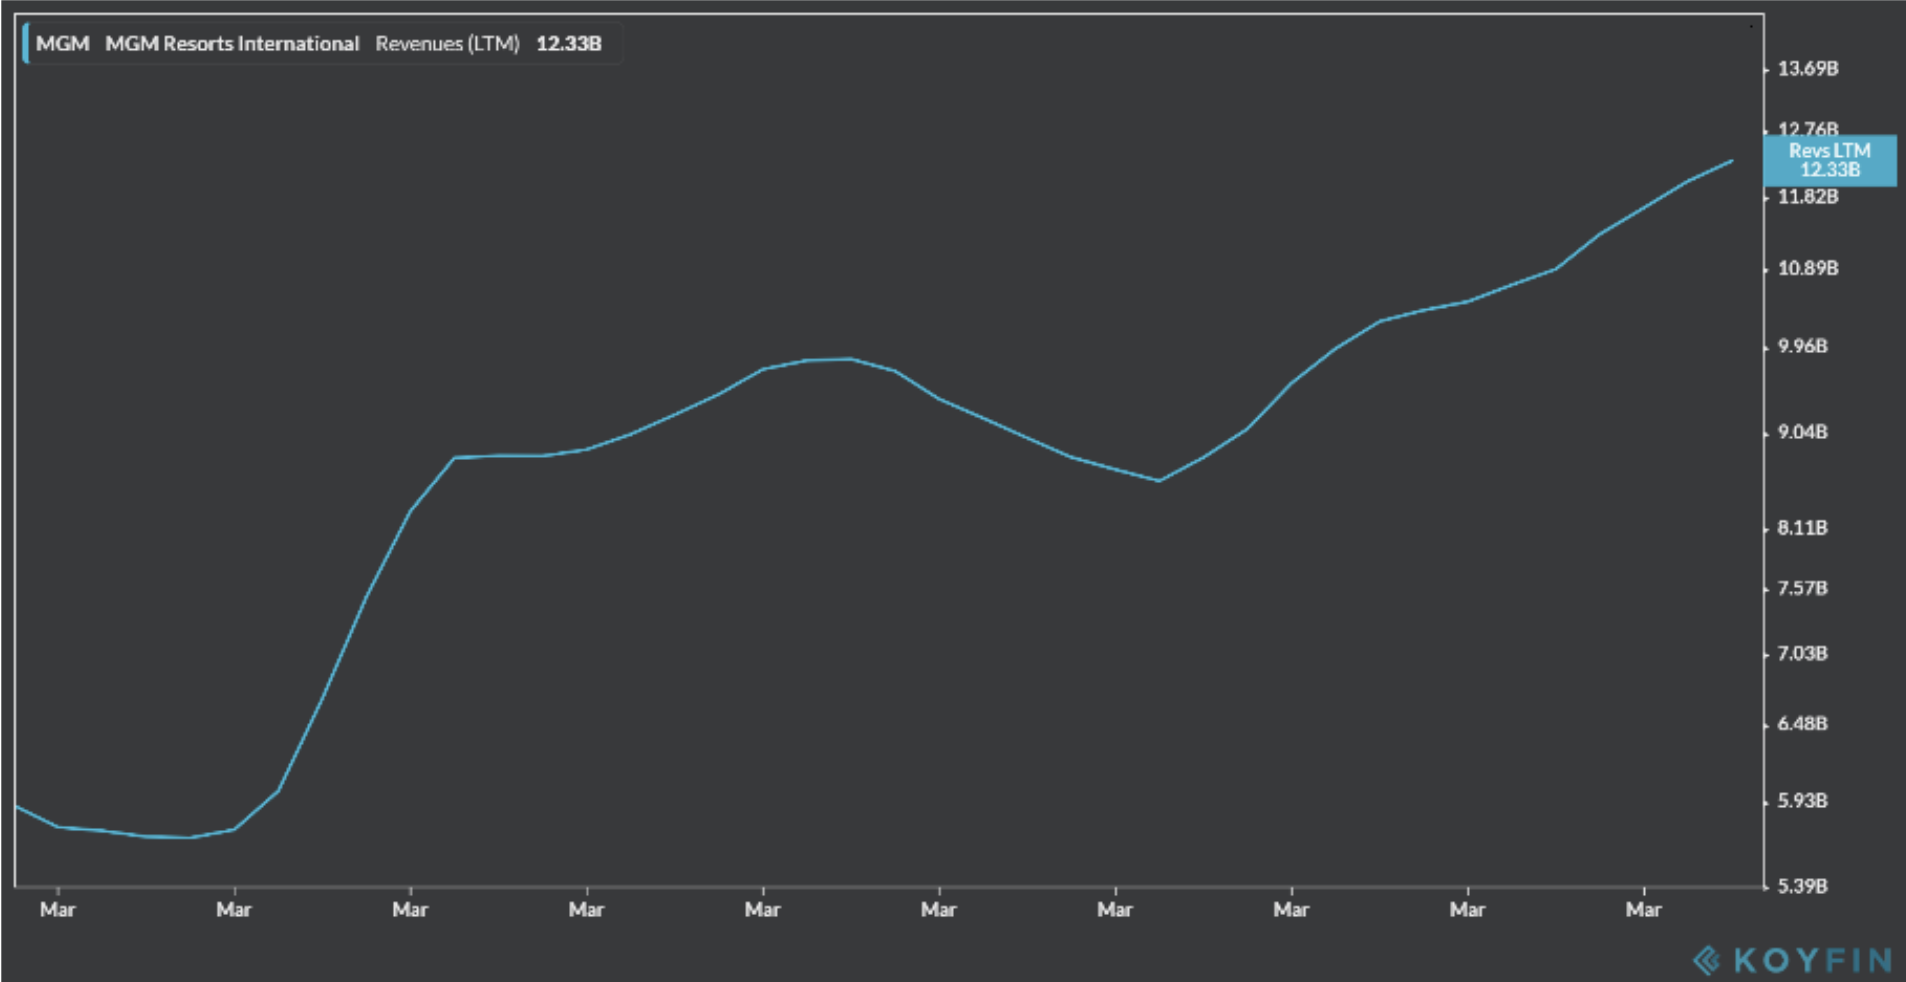
Revenue for the past decade
  • MGM posted revenues of $3,314 for Q3 2019, up 2.8% from Q2 and up 9.4% from Q3 last year
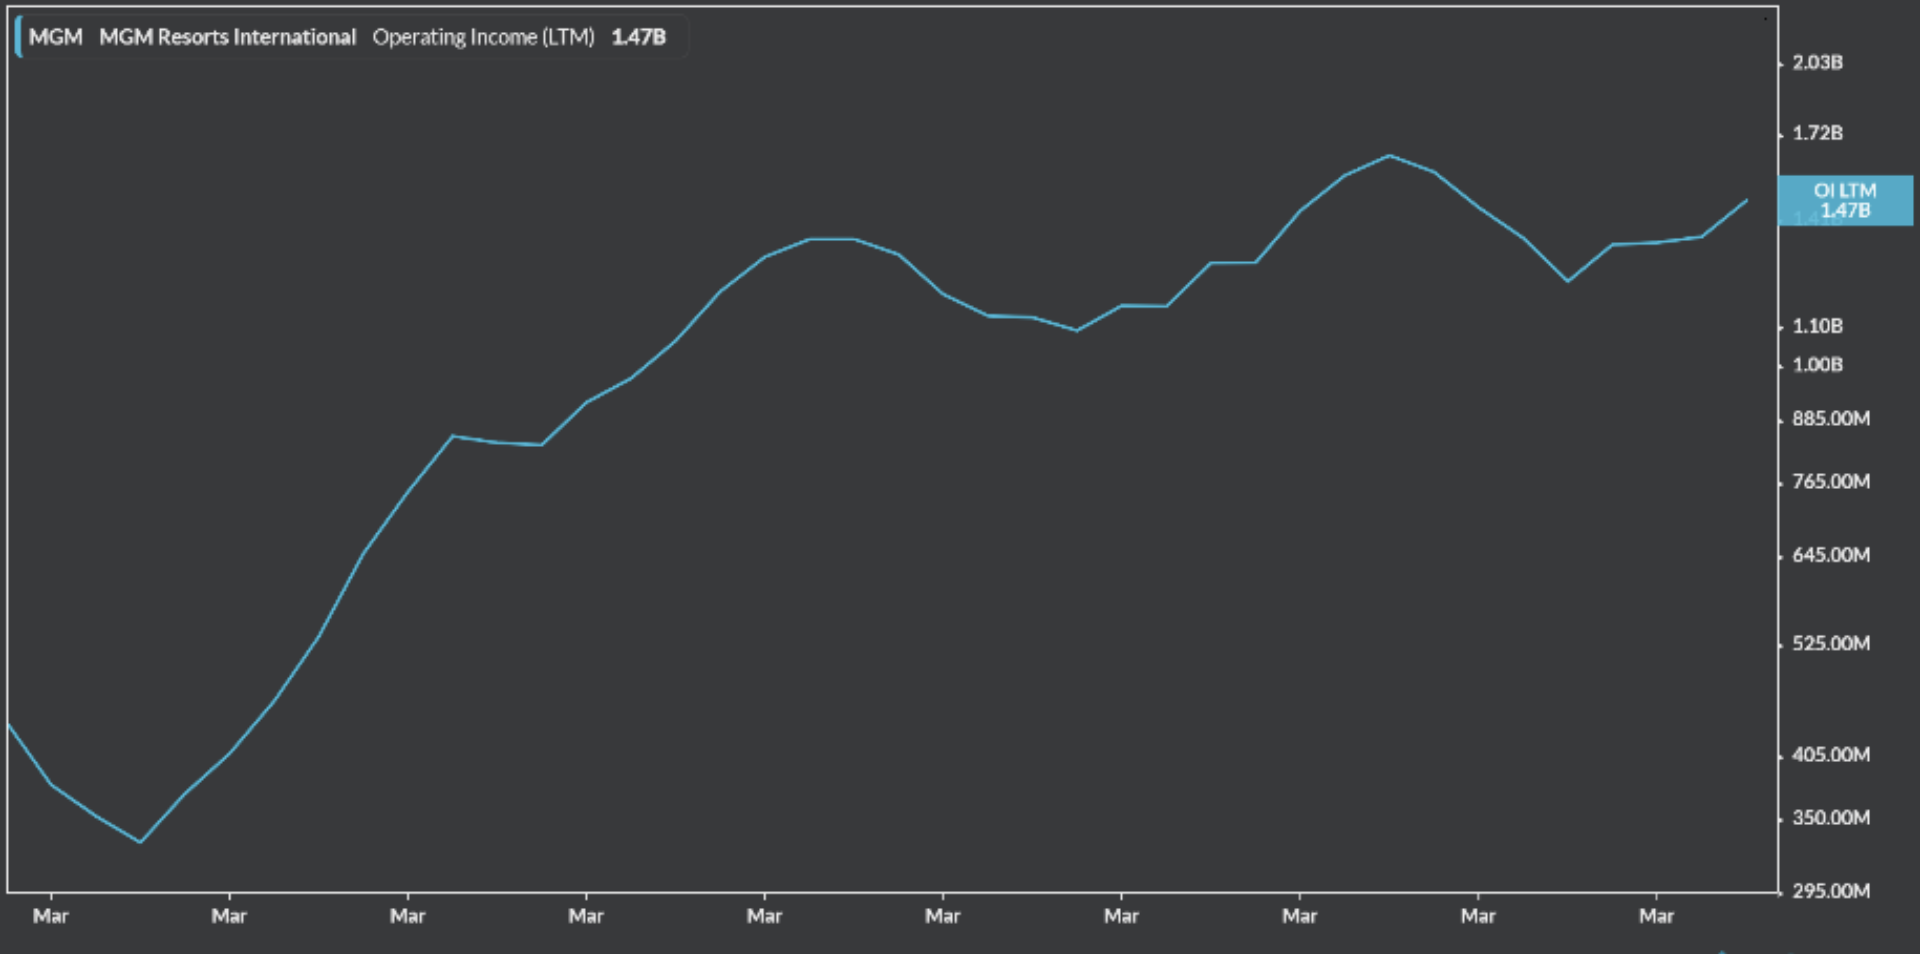
Operating income for the past decade
  • Operating income (Non-GAAP) was 452.0 for Q3 2019, up 21.8% from Q2 and up 10.2% from Q3 last year
  • EV/EBITDA- 10.5x
  • EBITDA margin: 20.69% in September, decreased slightly from 22.38 in August

From these numbers, I see MGM as a company with growing revenues and healthy financials. I also believe that a 10.5 EV/EBITDA multiple undervalues a company with such enormous potential for growth. For comparison, Las Vegas Sands has an EV/EBITDA of 10.9x, and Caesar’s Palace has a multiple of 11.0x. The only real causes for concern in their financials are that their EBITDA margin shrunk somewhat in September and their debt, the former I will cover now and the latter I will cover in the risks section. The slight decrease in EBITDA margin might concern some, however it is still on the higher end of EBITDA margins among its competitors. Part of this is seasonal, as the Q3 EBITDA margin for 2018 was also down from Q2 as Q3 contains some of the slowest months for sports gambling (July and August). For comparison, CZR has an EBITDA margin of 6.23%. The only competitor with a significantly higher EBITDA margin is Las Vegas Sands (NYSE: LVS), with a margin of 33.55%, whose owner has publicly said that he will not enter his company into online gambling in any way, a luddite mindset that I believe will hamper that firm’s growth in the future and allow MGM to take advantage of less competition from one of its biggest rivals in the gambling industry.

Risks (All numbers in millions)

One of the most immediately recognizable risks with MGM is that their interest payments are a large proportion of their operating income (in Q3 it was 47.6% of their operating income, and for FY 2018 it was 57.8%).These numbers might seem alarming, as bankruptcies in the casino industry, such as what happened to Caesars Palace (NASDAQ: CZR) in 2015 are not unheard of. However, MGM is undertaking debt reduction strategies to avoid this possible outcome. Although debt issuance has risen recently, they have also increased debt repayment. For example, in Q2 2019, MGM issued 2,500 in debt, but repaid 2,600. And with the money from the sale of several casinos, I do not foresee their debt being too big of an issue in the future. The sale, at $4,300, amounts to a significant proportion of their $14,943.9 long term debt load at 29%.  

Recommendation: Buy

Given MGM’s position in an industry that is primed for significant growth and their healthy financials, I recommend buying equity in the company. I believe that MGM will grow significantly in value as more and more states legalize sports wagering, and they grow their market share in states that already have sports wagering with their new asset light strategy and campaigns to expand accessibility to and recognition of the BetMGM online platform. 

 

The Fragile Future of AMC Theatres

By: Danny Irvine & Nathan Szeto

No informed investor needs to be told that the movie theater industry is in dire straits with the rise of streaming services like Netflix, Disney+, & Amazon Prime Video, to name but a few. So why in the world would you want to buy stock in any movie theater chain?

The answer: You wouldn’t.

Ok, great. But what about American Multi-Cinema, better known as AMC? It is the biggest movie theater chain in the world, after all. However, it didn’t get that way without taking on massive amounts of debt. This reality, coupled with decreasing revenue figures, market trends, and a poorly executed vision, has positioned AMC to be a poor stock pick within the near future, and a potentially catastrophic one in the event of a recession.

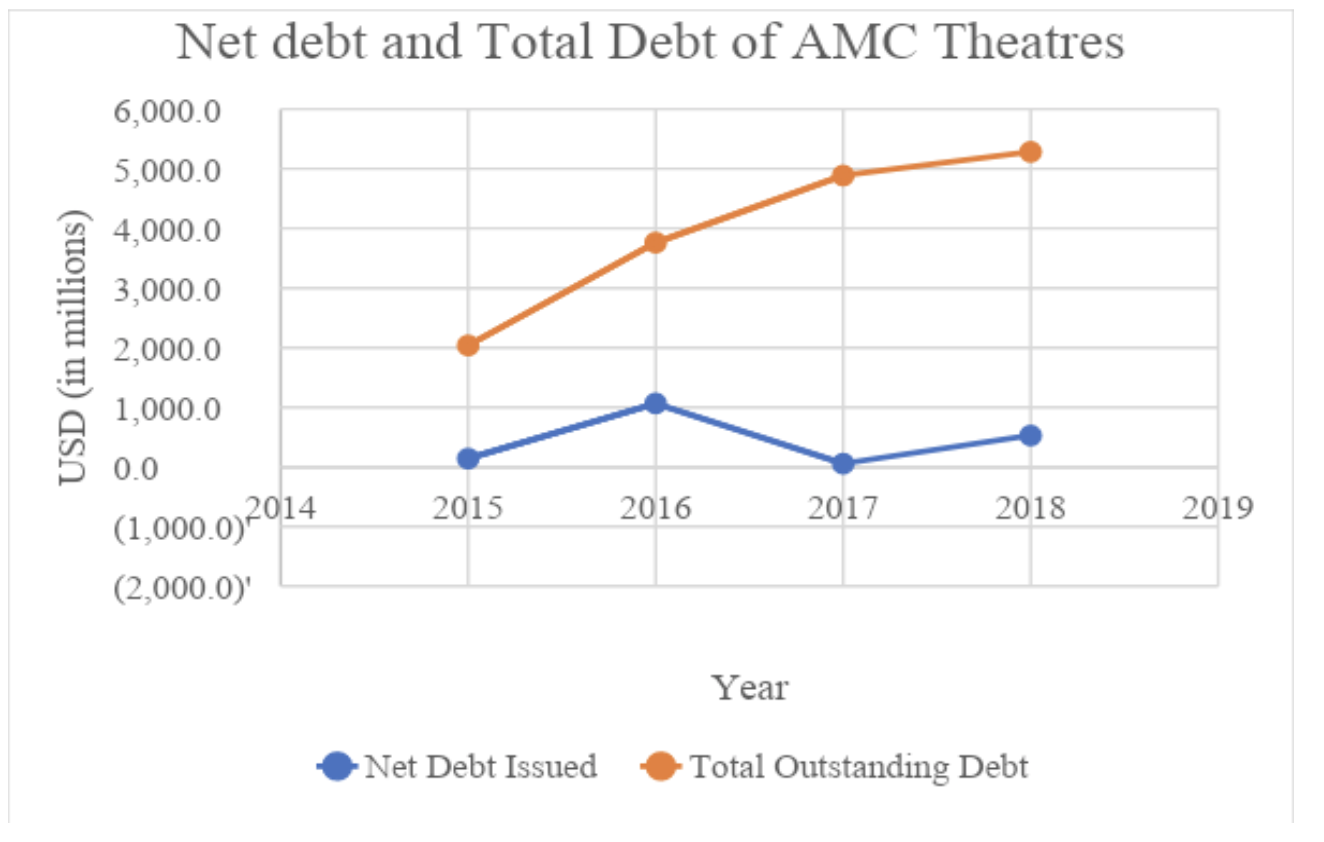
It may seem to the average investor that AMC has increased performance in recent years, and AMC’s yearly total revenues would support that assertion: in 2015, it produced $2.9 billion in revenue, and in 2018, it posted $5.4 billion, an increase of 86%. However, AMC’s revenue growth is deceivingly high because the company has not grown organically. Instead of committing to improving the movie-going experience for its customers, AMC’s corporate branch has embraced an expansion mentality. That’s right, the largest movie theatre company in the world is looking to increase their foothold in its stagnating industry via acquisitions. It’s important to note that we aren’t suggesting that AMC intends to monopolize, but rather it values quantity over quality of their theatres. Since 2015, it has acquired 700 theatres and has issued massive amounts of debt to fund these purchases. As can be seen in the chart below, the company’s total outstanding debt has exceeded $5 billion as a result. Seen in the same figure, the company’s net debt indicates the change in total debt. In 2016, AMC issued $1.75 billion in debt, all of which the company stated went to fund the acquisitions of movie theatre companies in Europe and Asia. In 2017, they made a large sum payment of $748 million to repay debt, but that hasn’t halted its persistently increasing amount of outstanding debt, which at the end of 2018 was $5.2 billion. Understandably so, being in the theatre business is very capital intensive, but the corporate acquisition strategy has jeopardized AMC’s future. The company’s financials reveal that its return on assets (ROA) percentage has been declining over the last few years. Since 2015, the ROA percentage has declined from 3.1% to 1.0%, with consistent decline each year, excepting 2018.

Figure 1: AMC Theatres total debt and net debt from 2015 to 2018

We’ve already mentioned that AMC is at risk of bankruptcy in the event of a recession, but what exactly do we mean? Given that AMC is already operating on very slim margins and is saddled with massive amounts of debt, it’s not too far of a stretch to believe that if the US economy experiences a recession, AMC will lose the ability to pay off its interest and eventually have to file for bankruptcy. For instance, with an operating income of $317 million and net income expense of $224 million, AMC has little room for error if their revenues drop even slightly. Also, the company’s net income margin percentage in 2019 was 0.2%, down from 9.6% in 2017, giving one a sense of just how slim the company’s margins are.

Think about it — is going to see the new Frozen 2 movie really a priority when you’ve just lost your job? (The answer should be no) Now multiply this sentiment by a few hundred million would-be moviegoers and you’ve got a bonafide crisis on your hands.

So why should we believe that a recession is imminent? According to a survey done of economists by the National Association for Business Economics, 3 out of 4 economists believe that the United States will experience a recession by 2021. Ray Dalio, founder of Bridgewater Associates, believes that prior to the 2020 election there is a 40% chance of a recession, up from 35% in February. These fears are supported by the ongoing trade war between China and the United States, as businesses scale back investment and struggle to maintain output levels. Lastly, within the last few months Treasury 10-year bonds fell below those of 2-year bonds. This situation, known as an inverted yield curve, has historically signaled that investors are reinvesting into safer assets and has preceded every recession since 1955. Even if these signals are all wrong, we are hard pressed to say there will not be a recession ever again. And when on hits, 2021 or 2025, AMC’s acquisition-fueled hopes and dreams will likely be demolished.

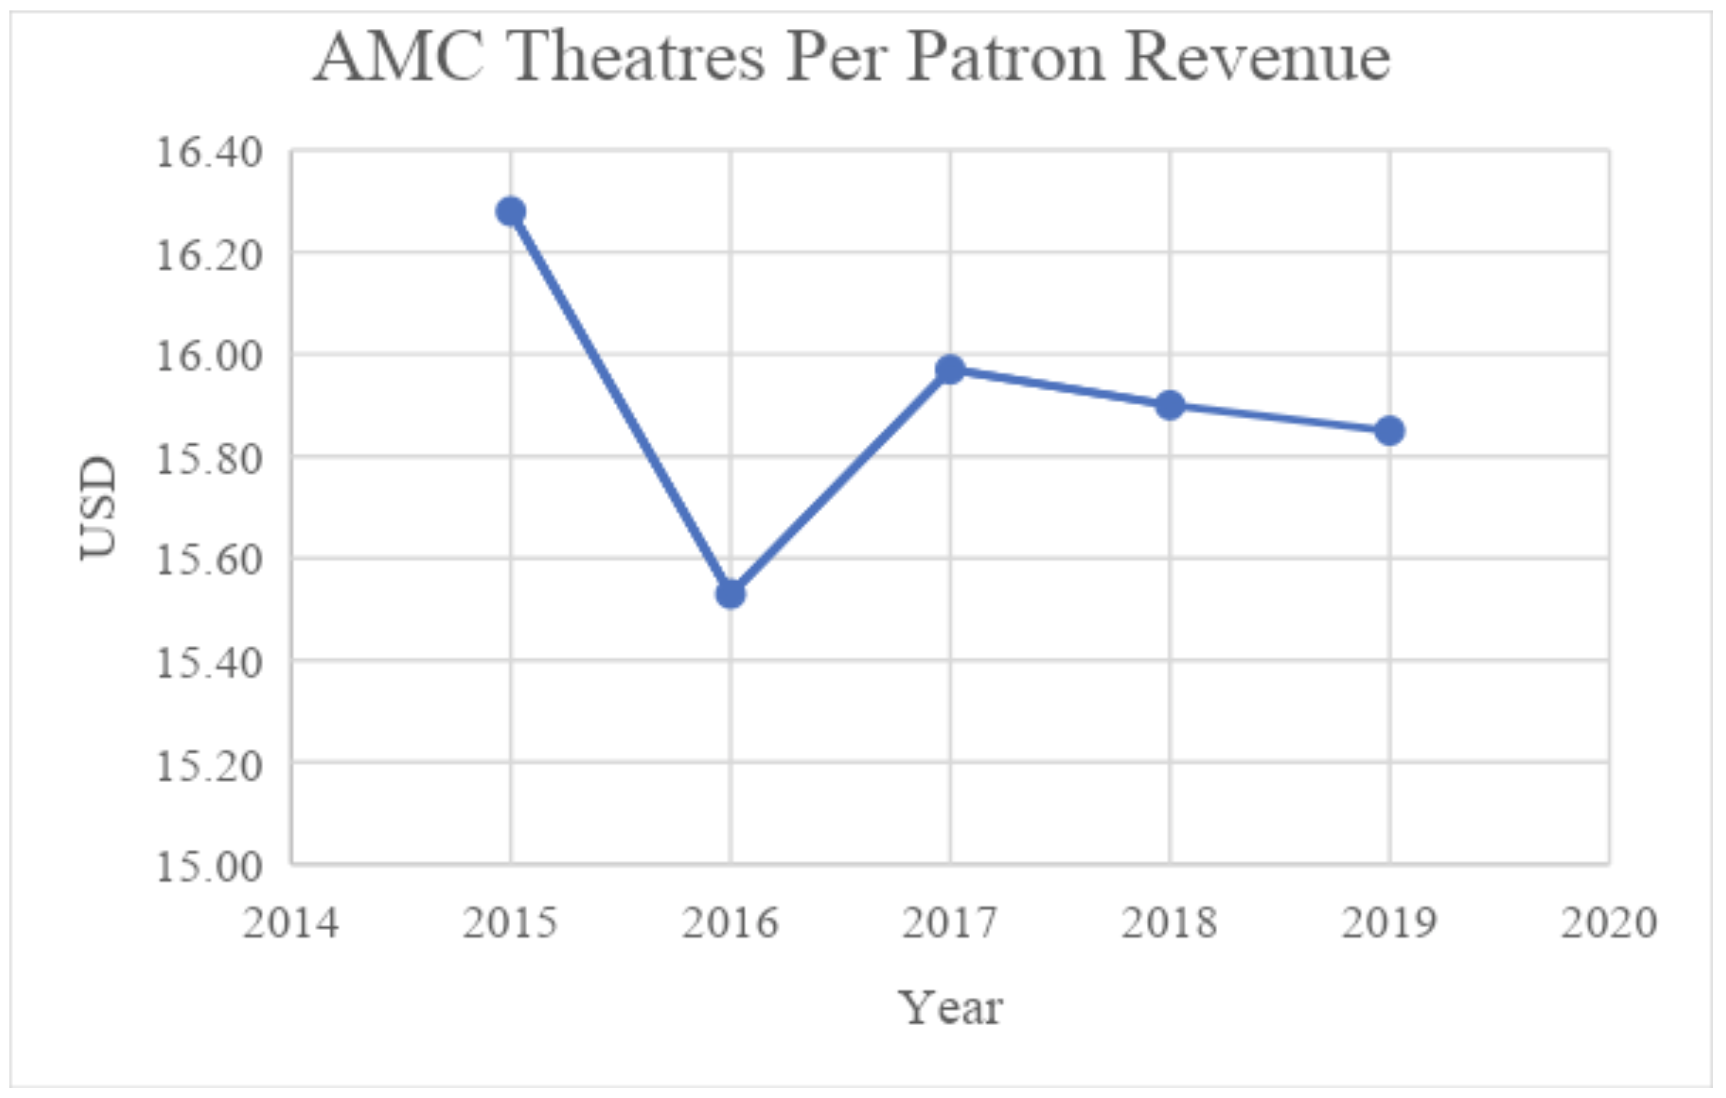
Figure 2: Per patron revenue from 2015 to 2019

AMC proponents would point out that the company has invested in the upkeep of some of its theatres to reduce asset depreciation. The most significant improvement was of 2,279 screens in 2018, with another 600 planned for 2019. Improvements include replacing traditional seats with fewer, but higher quality plush recliners, and improving dining options. This allows AMC to sell seats at higher prices with the goal of improving revenues per movie screen As of now, AMC improved over 2,200 screens, but they own 11,000 in total, leaving potential for a ton of  depreciation and high capital expenditures (likely via even more debt) to occur as improvements perpetuate.

We looked at AMC’s revenue per patron because it better indicates its revenue change organically (controlling for acquisitions), compared to their total top-line numbers. The statistic reflects the average amount of money AMC earns from each customer through the ticket and food and beverage purchases Conveniently, it doesn’t take into account quantity of customers, so we can examine solely the quality of how AMC obtains revenue. Since 2015, there has been a 7% increase in the number of patrons choosing to buy food and/or a beverage (from 64% to 71%), suggesting that revenue per patron should increase. However, the overall trend is decreasing. Figure 2 shows the revenue per patron adjusted for inflation from 2015 to 2019. Although the margins seem small, there is a 75-cent decrease per patron. Considering the many thousands of people that visit AMC’s theatres each year, that 75-cent decrease will significantly wound organic revenue streams. Overall, the company has extracted less money from the customer over time, which they hope to offset with their new streaming service.

As if those numbers weren’t already depressing enough, the company has demonstrated no clear vision for moving forward best embodied in its decision to launch a new streaming service, as if consumers weren’t already inundated with other options. However, to add insult to injury, they have decided to structure it in the worst possible manner. Known as “AMC Theatres On Demand,” as uninspired a name if there ever was one, it is nothing more than a glorification of Google Play or iTunes, versus a proper streaming service. At least Google Play and iTunes admit that they’re not good deals. On top of the $15 annual membership fee required to use the service, each and every film and show has to be either rented for $3-6 or bought for $10-20.  The movies are neither exclusive nor early access, as would be hoped for from the world’s largest movie chain. Even though the service provides in-theater benefits, value provided is still extremely poor and will likely fail to contribute to AMC’s bottom line meaningfully.

The launch of the streaming service is a symptom of a larger problem at the megacorporation that is American Multi-Cinema. That AMC’s leadership feels that yet another streaming service is necessary to raise profit margins indicates that it lacks the vision and creativity necessary to reverse the course of a company in an already dying industry. It reflects a management desperate to turn around a faltering company via uncalculated grasps for salvation.

The reality is that AMC is a company without ideas in a dying industry. Falling actual revenue per patron figures coupled with a massive debt load indicates that the company not only lacks future potential for growth but is extremely at risk of defaulting on its debts and filing for bankruptcy in the event of a recession. Worst of all, the debt AMC has accumulated has done little to grow its falling revenue.


Philip Morris (PM): Smoking hot! (Sort of)

By Michael Davis

As the parable goes, markets hate uncertainty. Right now, the tobacco industry has a lot of uncertainty. In the last decade, the percentage of adults who smoke decreased 700 basis points and increasing health-consciousness in the U.S. promises to decrease that number further. The government’s war against popular e-cig brand JUUL has not helped either. In the wake of 34 vaping related deaths, federal legislators have promised to introduce even more regulations onto the tobacco industry. These facts scare the market. But they shouldn’t scare you.

Enter Philip Morris International (PM). When I first started following PM back in September, the JUUL inquest was at its peak, an Altria-PM merger threatened PM’s independence, and the PM stock was trading at $71.90. My advice was to buy. I expected strong international sales, the introduction of IQOS (expanded upon below), and the fear of regulations to dissipate, all of which would culminate in a rebound. As of this article’s writing (1/15/20), PM trades at $88.80 (a 23.5% increase since I recommended buy). I was right. Dope. But now what? Is PM still a buy? My answer is still yes, but don’t expect the same fireworks.

Background:

After splitting from its parent company and JUUL owner, Altria, in 2008, Philip Morris has positioned itself as a top dog in the tobacco industry. And as the JUUL controversy has dampened Altria’s stock, Philip Morris has steadily rebounded and should continue to do so. As the industry transitions from combustibles to vapes, Philip Morris’ introduction of its IQOS product into U.S. markets will strengthen its foothold in the domestic market. And though this new e-cigarette is still only a piece of the Philip Morris pie, it has the potential to propel its parent company for years to come. So, what is IQOS? In real terms, it is a new type of e-cigarette that heats tobacco instead of burning it. This difference has been Philip Morris’ battle cry as they’ve marketed the product throughout the world, as they claim the heating process significantly reduces the level of harmful chemicals introduced into the lungs. The FDA maintains that tobacco in any form is dangerous, but if JUUL has taught us anything, it’s that consumers don’t particularly care. And while international markets have responded well to IQOS for some time, the U.S. foothold will prove crucial to its success. Currently, IQOS is the only FDA-approved heat-not-burn tobacco device and has only just been introduced to U.S. markets. In financial terms, IQOS is the catalyst for strong future growth that will maintain the historical financial strength of PM.

Financials:

On a scale of feta cheese to superman, Philip Morris’ financial strength comes in around the 7.5 mark. Despite the uncertainty in the tobacco market and the decreasing consumer base of tobacco users, revenues have only dropped 3% over the last five years. And while its EV/EBITDA is 12.74 compared to the EV/EBITDA of its biggest competitor, Altria, of 10.4, the real value in owning PM derives from the dividend. Currently, PM pays out $4.59 per share at a payout ratio of 95%. And while some of your alarm bells might ring at the huge portion of revenues going to that dividend, know that PM has increased its dividend for 11 straight years, even through the recession while maintaining their historically strong revenues. So, if a recession yanks PM’s value from its steady climb, the dividend will play the part of velvet pillow to land on. So, while the value of PM probably will not climb 23.5% again in the next four months, there are plenty of reasons to own this heater of a stock.

Microsoft: Bandwagon Buy, Or Calculated Investment?

By: Shayan Moazeni

You are on a random walk down some street (let’s say it’s not Wall Street). You ask a random stranger for stock ideas. Off the top of their head, they will recite the FAANGs — large household companies like Amazon, Apple, and even Microsoft. At first sight, a stock that the Average Joe recommends is likely not a clever investment. But Microsoft continues to profitably reach for the clouds.

Microsoft (NASDAQ: MSFT) has had quite a year: its stock is up 46% (YTD) and it has won two government contracts, worth a total of $17.6B over the next ten years, to provide the federal government its dominant hybrid cloud product. Azure, its cloud system, is the competitive advantage that, along with the unique breakdown of Microsoft’s revenue, transforms the company from just a “bandwagon” buy to a calculated investment. I will analyze both of these points in the rest of the article.

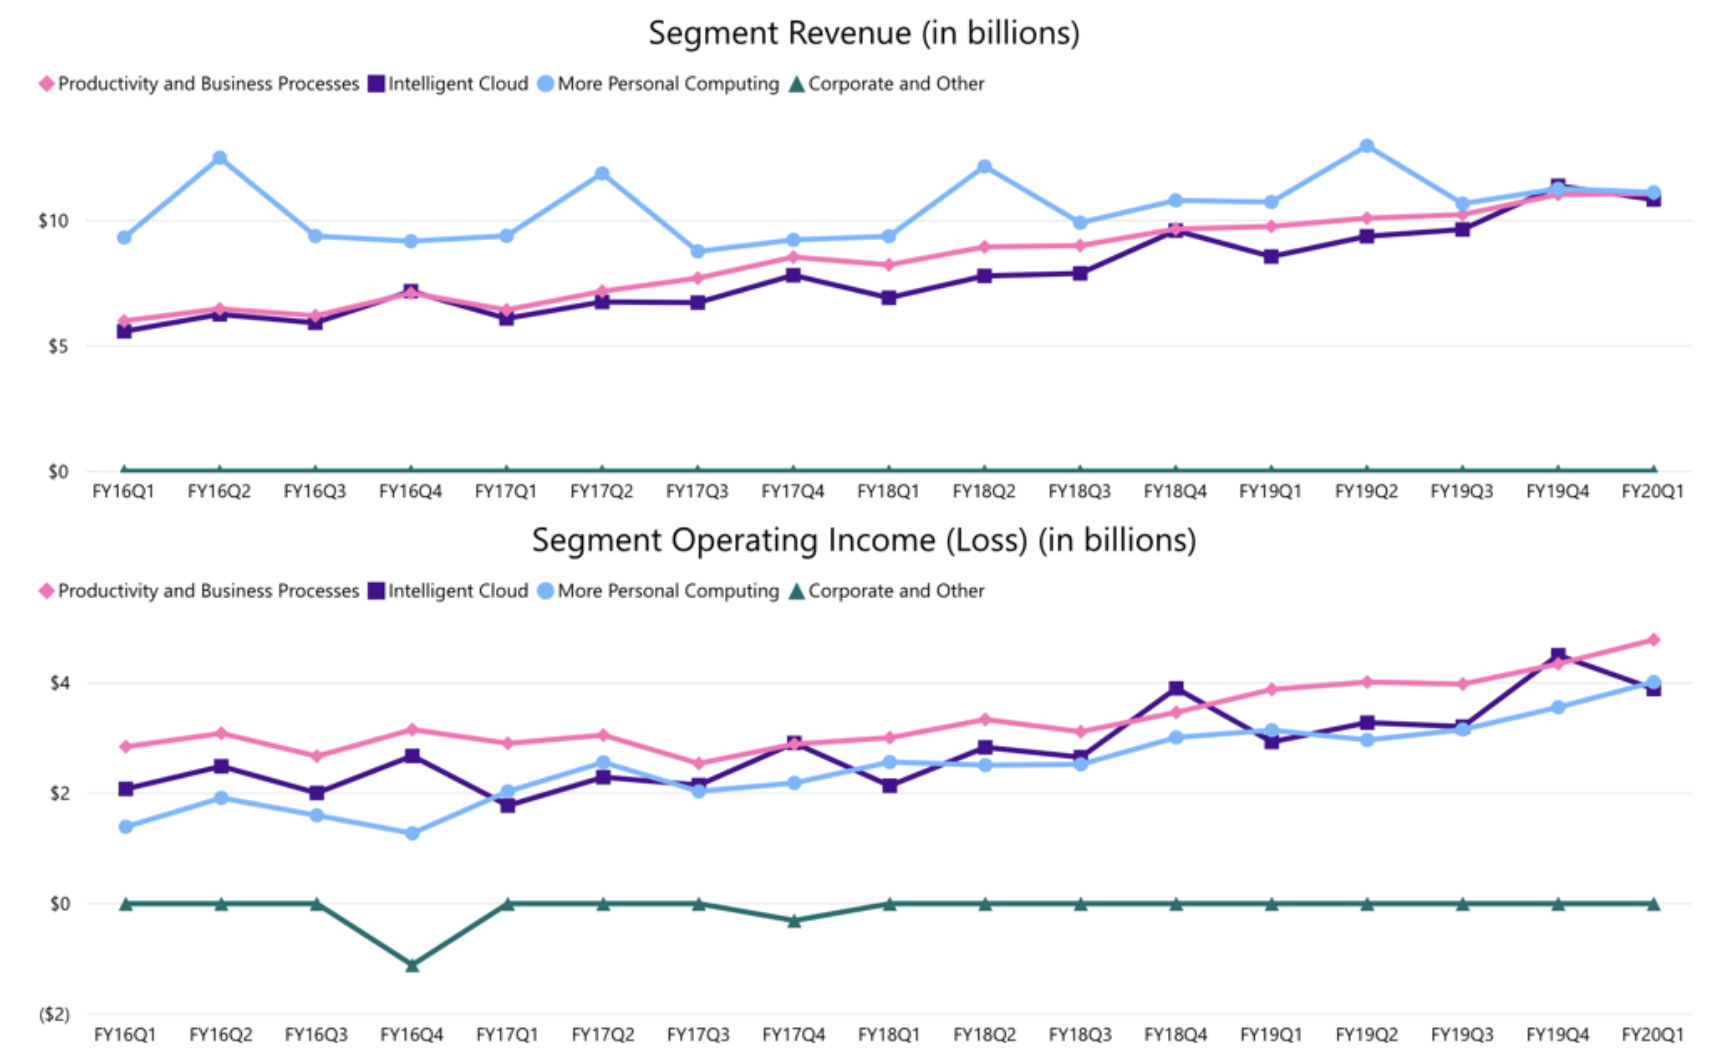
Figure 1

A Deeper Dive Into The Business

Microsoft’s revenues and operating income are both up 21% (YoY) this year, but what makes this growth more impressing than that of, say, Apple, is the structure: while over 52% of Apple’s revenues come from the iPhone, Microsoft’s cash flows stem almost perfectly evenly from three segments: “Productivity and Business Management”, “Intelligent Cloud”, and “More Personal Computing.” This even distribution of income greatly reduces the risk of revenue loss from a single product, putting the firm in the best position for the long run.

  • In Productivity and Business Management, revenues are up $1.3B (13%) for the quarter, $807M of which is from Microsoft Office (a 13% increase), and $379M of which is from Microsoft’s new acquisition, LinkedIn (a 25% increase, already proving to be a smart investment). These two platforms have helped the 16% increase in gross margins in the segment, leading to an impressive 23% increase in segment operating income.
  • In More Personal Computing, revenues are up $387M (4%) for the quarter, lifted by a 9% increase by Windows and 11% increase in search advertising, while gaming revenue is down 7% due to the cyclical nature of the sales of the Xbox (revenues from hardware sales are down because the latest Xbox was released in 2013, but content and services revenues are unchanged). Operating income increased 28% due to a shift to higher margin businesses, among other things.

This brings us to the main focus point of the article, Microsoft Azure, which currently accounts for 32.8% of Microsoft’s revenues. Running on a 36% operating margin, revenues and operating income from Azure are both up 21% (YoY) thanks to the strong hold Microsoft has on the cloud market, with a market share of 17.7% in 2018 and 18.2% in 2019. As mentioned before, Microsoft has also secured two contracts with the federal government for its hybrid cloud system, adding $633.6M to its annual operating income over the next 10 years. The hybrid cloud allows users of Azure with sensitive information to secure most of their information on the cloud system but keep certain bits of the data offline to prevent Microsoft, hackers, and other third-party users from accessing the information. By fixing this issue, Microsoft has opened its cloud system to hundreds of potential clients who may have previously been hesitant to storing their data on Azure. 

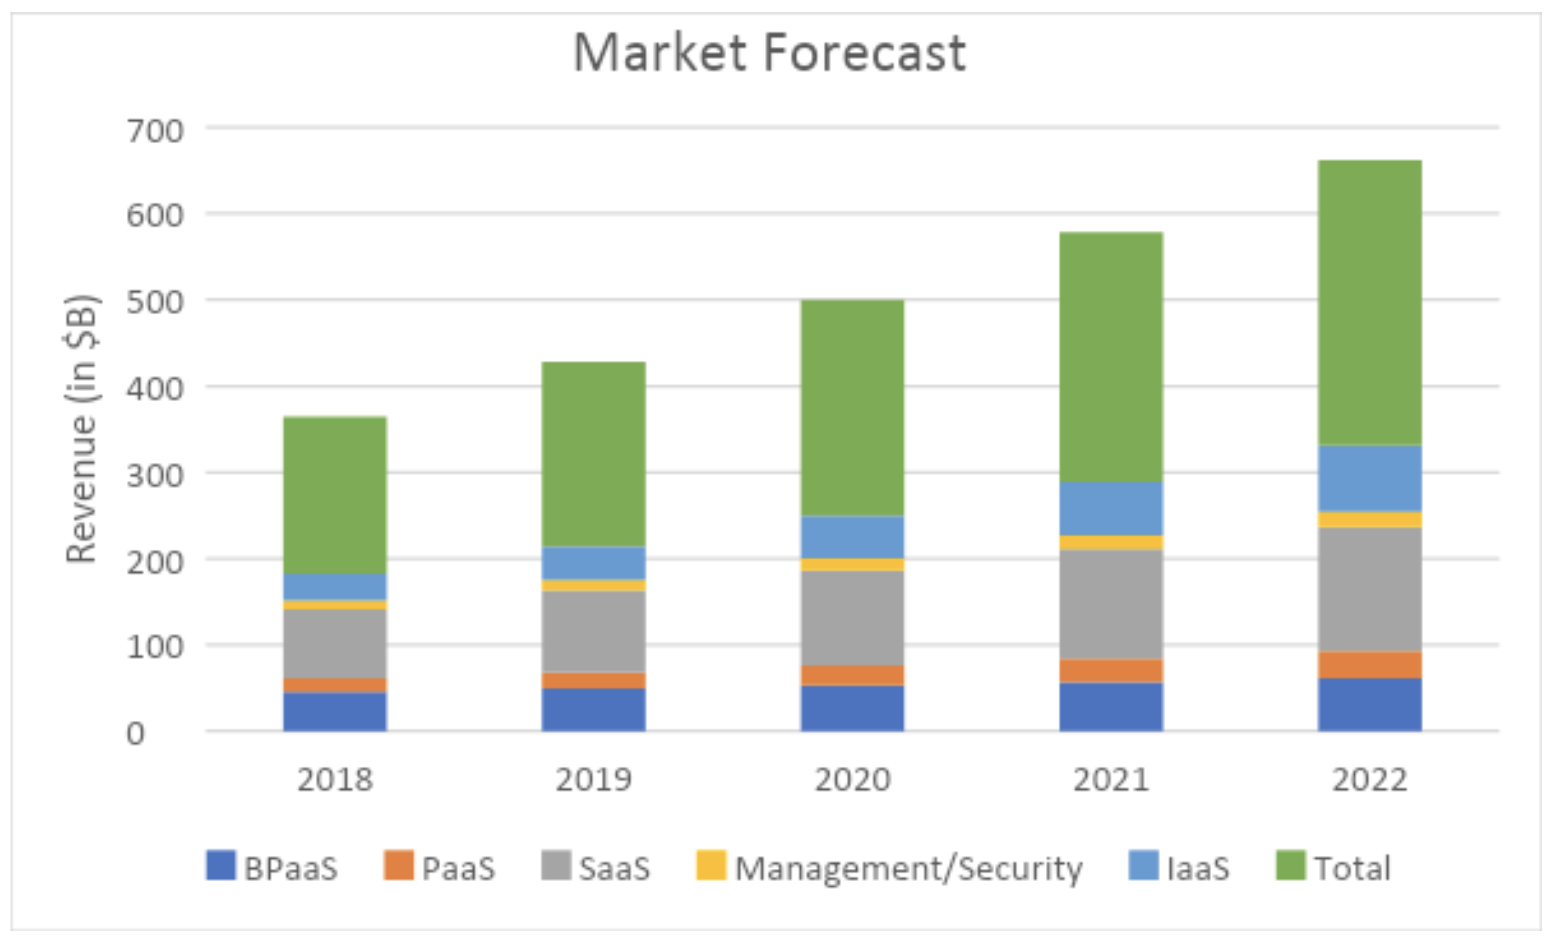
An analysis of the market for cloud supports this. As Gartner reports [1], the annual revenue generated from cloud activities across the market is predicated to grow from $214B in 2019 to $331.2 by 2022, a 55% increase. 

Figure 2


Valuation

In the first two segments, not much is expected to change for Microsoft save for the release of the new Xbox in 2020. Since Microsoft’s margins are surprisingly low on the Xbox hardware [2], the release of the new Xbox will not have a significant impact on the net cash flows to the company and gaming EBIT will continue to mostly stem from subscriptions and games, which are not subject to much change. For this valuation, despite the impressive growth in Productivity and Business Management and More Personal Computing segments (average growth of 24% and 23% respectively), I will assign a conservative 20% annual growth to those segments through 2022.

Finally, the cloud business. According to the aforementioned market forecast data, total revenue generated in the cloud business grew 17.5% from $182B in 2018 to $214B in 2019. In the same year, Microsoft’s cloud revenue (and EBIT) grew 21%, asserting its dominance over the cloud market. Due to Microsoft’s strong hold on the market, it is reasonable to expect this trend of beating the cloud market to continue. Below is a numerical summary of figure 2 along with Microsoft’s expected revenue from its (linearly) growing market share as well as Microsoft’s expected EBIT (using it’s consistent 36% operating margin) which also includes the annual $633M income from its two government contracts.

Segment/Year 2018 2019 2020 2021 2022
Total Market Revenue 182.4 214.3 249.8 289.1 331.2
MSFT Market Share  17.70% 18.20% 18.70% 19.20% 19.70%
Microsoft Rev 32.23 38.99 46.7126 55.5072 65.2464
EBIT (with gov contract) 11.52 13.92 17.45 20.616 24.122
Growth (YoY) 21% 25% 18% 17%

Figure 3: all raw values are in billions of dollars

As the model suggests, Microsoft’s operating income from cloud will double by 2022. Using this value and the expected growth in the other two segments, I predict Microsoft’s future EBIT as follows:

Segment Business Cloud Personal Comp Total
EBIT 29.6 24.12 23.6 77.3

Figure 4: all values are in billions of dollars

Using the consistent EV/EBIT ratio of 23 for Microsoft in recent years, this yields the following values for enterprise value. With a steady net debt of $50B, I have estimated the following values for market cap (EV+net debt) and thus share price (with 7.7B shares outstanding).

Enterprise Value Market cap Share Price Return
$1.778.9T $1.828.9T $237.5 59%

Figure 5: 

One obvious question here is whether the current EV/EBIT of 23x is an overvaluation. Below are the share price and EV/EBIT ratios for Microsoft and Apple.

If Microsoft’s EV/EBIT catches up to its share price in a similar manner to Apple’s, we can expect a multiple over 30x according to the graph, which can result in the following valuation in 2022:

Enterprise Value Market cap Share Price Return
$2.320T $2.370T $307.8 106%

General Mills Can Make You the Big Bills: Why GIS is Worth the Risk

By Nilay Neelaveni

In this article, I will be covering General Mills (GIS), a consumer food manufacturer and marketer. Its many well-known brands include Annie’s Homegrown, Yoplait, Pillsbury, and Cheerios. 

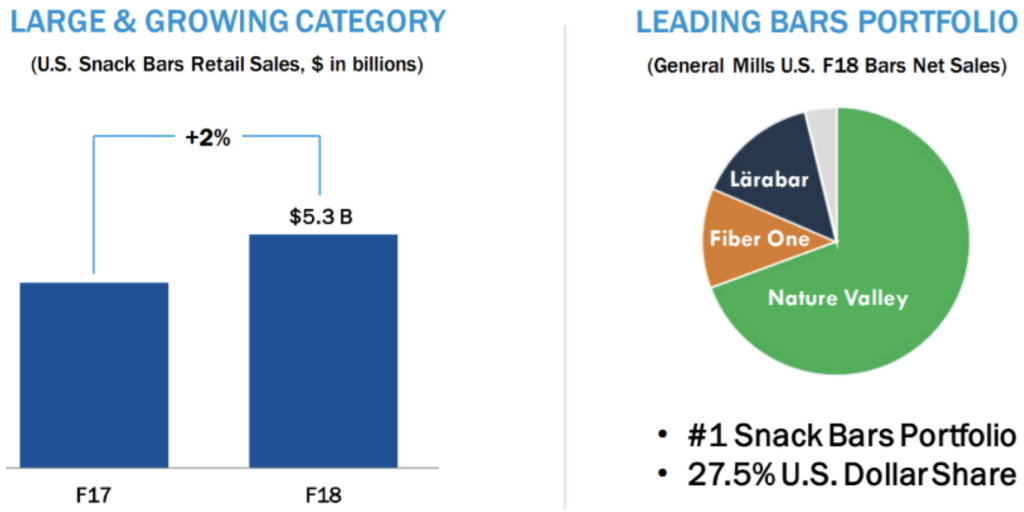
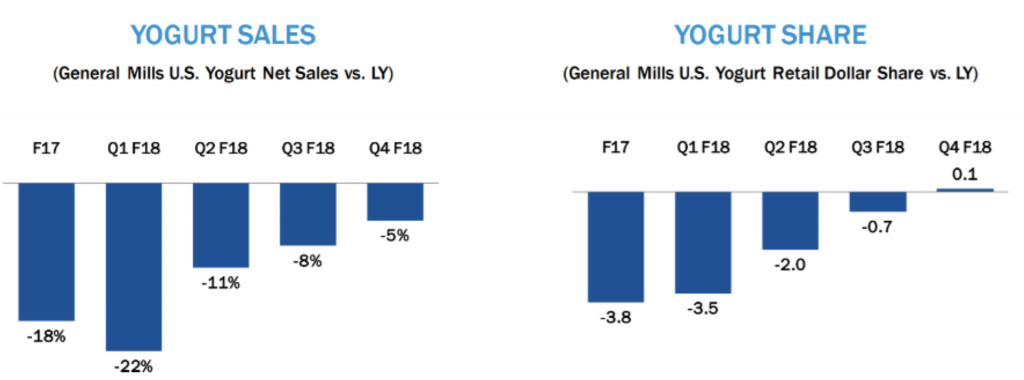
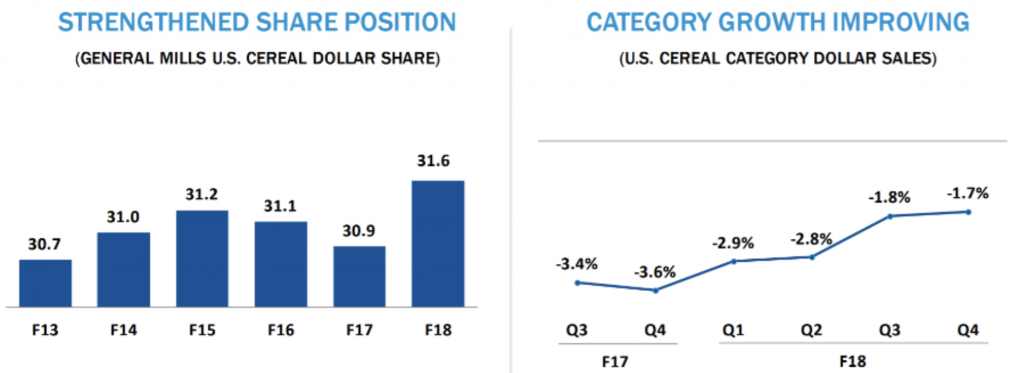
From 2018-2019, net sales changes were characterized by cereal’s flat performance, yogurt’s 2% dip, and snack’s 4% drop (GIS’s main business segments). The growth driving capabilities mentioned in the investor presentations—improving packaging and pricing, innovating products, improving e-commerce (i.e. Boxtops), building more sponsorships, and increasing media coverage – provided reasons for optimism. Apart from GIS’s main products, it also started pushing more BLUE pet food, an area with lots of potential for growth because of the expanding market. Q3 2019 displayed flat growth in net sales of GIS’ main products like cereal (677.1 to 685.5 million), yogurt (514.8 to 495.2 million), and snacks (887.9 to 869.4 million). Pet net sales, however, grew approximately 458% (14.5 million to 80.9 million), which is a mix of investment and true organic growth. While net sales barely grew, GIS estimates that its net sales will grow 9 to 10% from the current $15.7 billion based on the investor presentation. Also important is that EPS also grew from .66 to .86 per share, indicating better financial health. Though it may seem like GIS’s main products are going nowhere, a glimpse into the slight upward trend of its market share and its main business segment sales, combined with the initiatives described above are promising. 

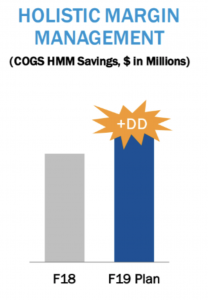
Though it may take some time for these sales to grow, GIS is knee deep in cost savings programs that are estimated to increase savings in 2019 according to their investor presentation. The positive trend of its food groups and increased savings means this company still has so much potential to grow with regards to growth in revenues and minimizing costs.


It is first important to note the EV/EBITDA also increased from 11.7x (2018) to 12.5x (2019). EBITDA has remained flat from 2018 to 2019 while EV has increased by about 10% from 420.3 to 460.0 million. In addition, the massive debt on this large company should not be a worry since the interest coverage ratio of 12.56x means this large cap company can cover its interest payments. On top of all this, strategic revenue management has helped increase operating profit margins to 18% from 16%. Furthermore, because the EPS has increased, dividend yield can remain at a 3.60%, which is the highest of its competitors.

This company has its sail set in the right direction as we have seen by the promising changes in GIS’s business model. As the revenue grows and costs decline, the net income and profits will grow significantly, which can translate into the share price. If these signs hold true, I believe this company is a buy.


Starwood Property Trust Inc (STWD)

By Kyle Sung   

Company Overview
Starwood Property Trust (STWD) is a real estate investment trust focused around real estate and infrastructure. STWD is one of the largest loan originators of any institution, and currently provides commercial, residential and infrastructure loans. The company’s current portfolio of around 16 billion dollars contains 4 business segments: real estate lending, real estate investing and servicing, property, and infrastructure lending. 

Investment Thesis
I recommend shorting the stock because the company is overvalued compared to its peer group, it faces interest rate risk, recessionary risk (due to potential yield curve inversions and weak housing market), and dividend unsustainability. 

The company’s extensive investment in variable rate assets exposes it to significant interest rate risk. To put this risk into perspective, around $8 billion of STWD’s $10.3 billion loan portfolio is comprised of variable rate loans. The ratio decreases when considering the $8 billion of loans are all being held for investment, resulting in a ratio of 8/9th of loans are HTM (the $8 billion includes 6.7 billion in commercial loans, and 1.3 billion in infrastructure loans). Approximately 84.9% of RMBS and a tenth of CMBS’ that STWD reported under the fair value option are variable-rate. 

Given the adjustable-rate nature of commercial mortgages and housing loans, interest rates and the net asset values of STWD’s portfolio are directly related. Thus, as interest rates fall, the net asset value of STWD’s portfolio stands to fall. Given current economic standings, including the Sino-American trade war, low manufacturing numbers, housing, slowing job growth and business investment, it is extremely more likely that the Federal Reserve will cut rates rather than raise them in the near future.

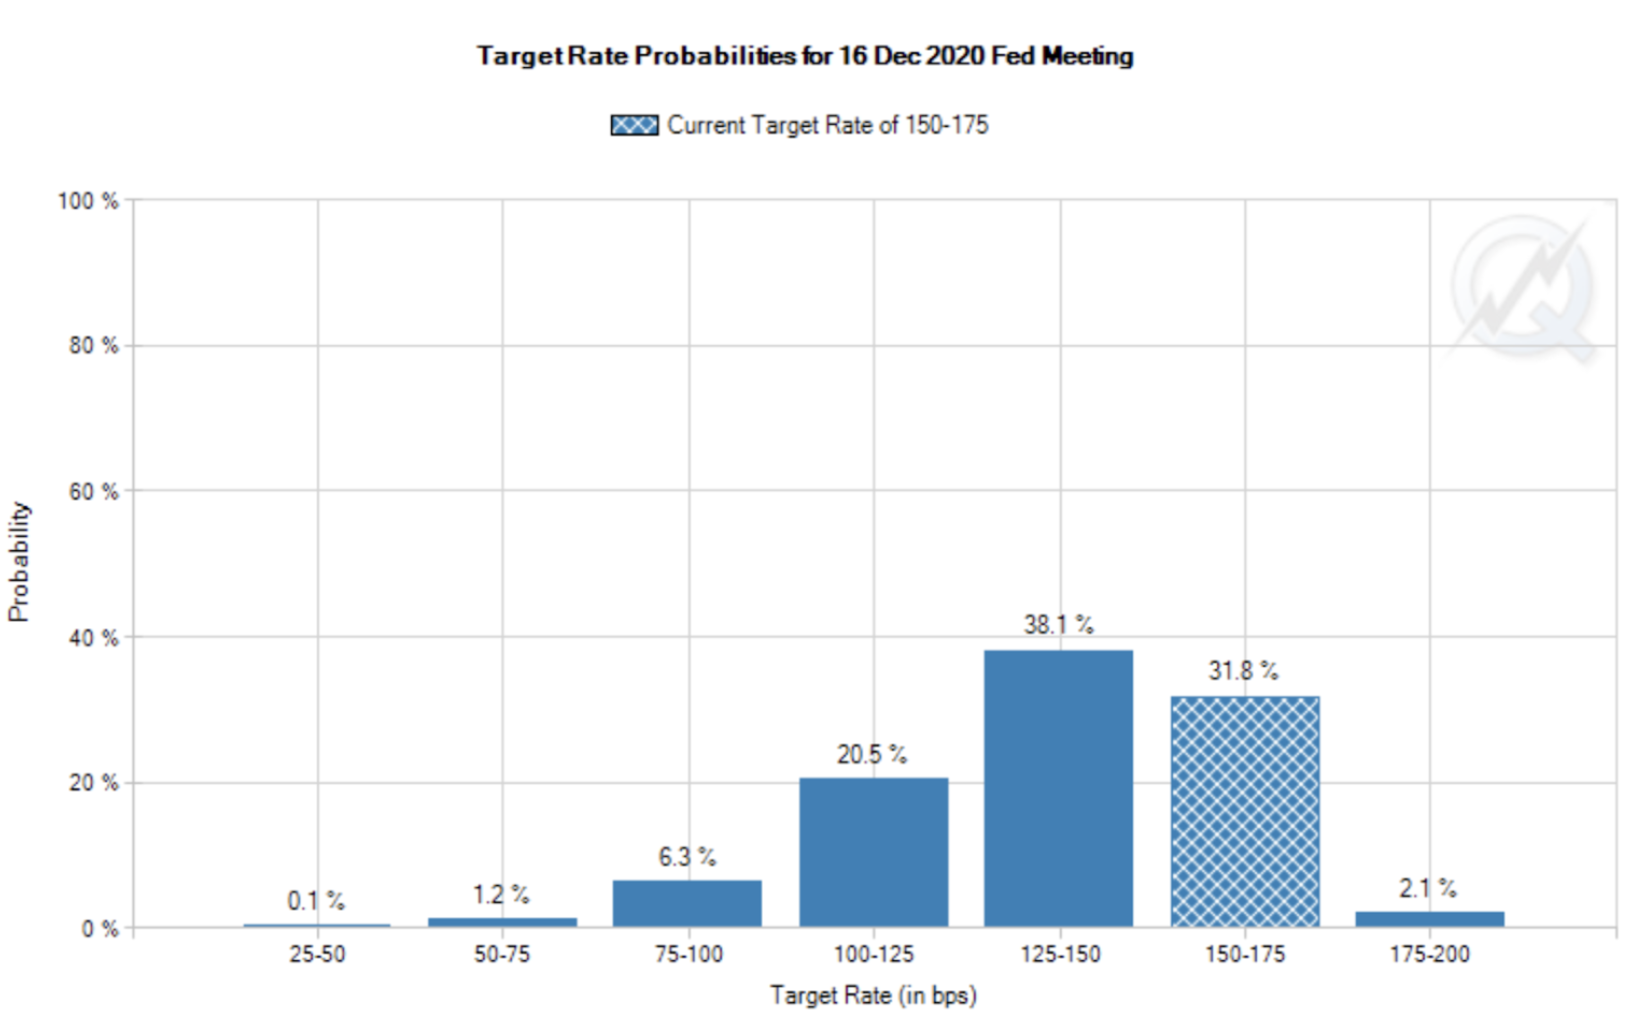
We can check the probabilities of future Federal Reserve rate cuts by looking at the Federal Funds Futures markets. According to a figure by CME Group (pictured above), the markets are currently pricing in a 66.2% chance of at least a 25bp rate cut, with only a 2.1% chance of a hike by the 2020 December FOMC meeting. 

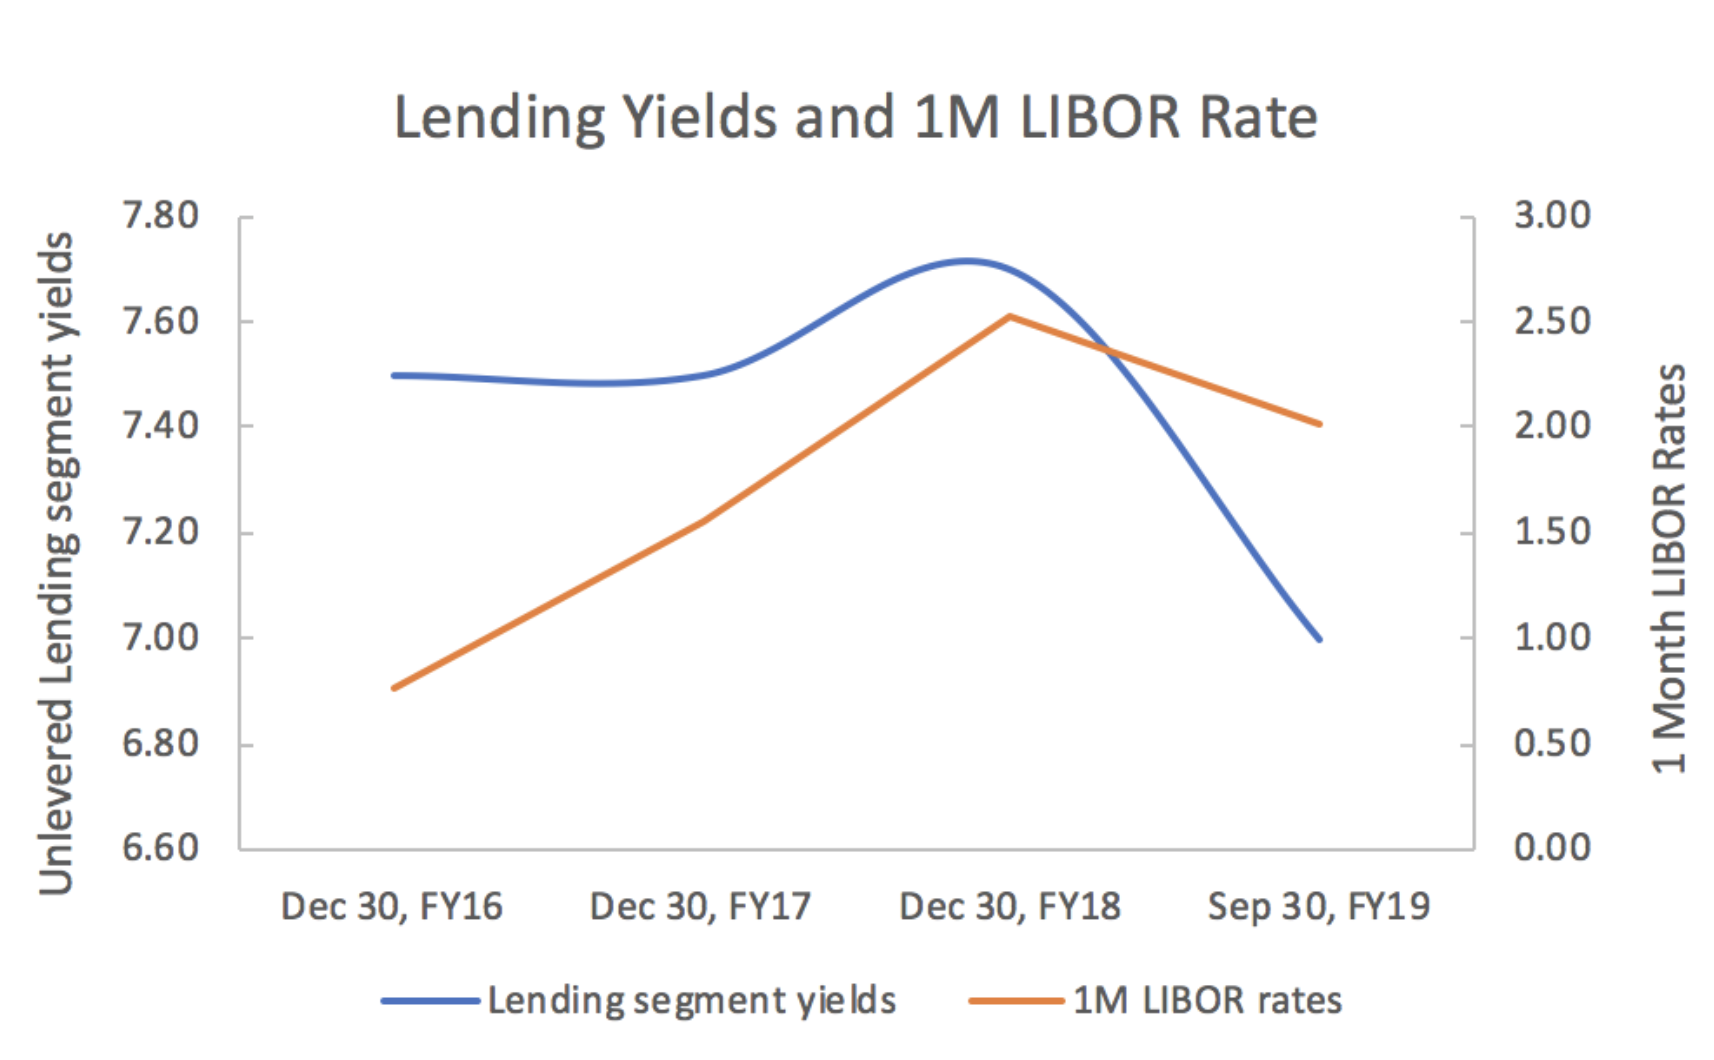
LIBOR rates have steadily climbed between 2015 and 2018. In FY18, STWD saw an increase of yields from FY17’s 7.5% to FY18’s 7.7% from its Commercial and Residential loans segment. The increase, while not overly substantial, was offset by compression of interest rate spreads in credit markets and a decrease in yields from fixed-rate residential loans. As seen in the figure below, there exists an observable, direct relationship between STWD’s loan yields and interest rates, and as the current global economic outlook worsens, we expect to see a decrease of yields across STWD’s Loans and REIS segments as a result of cuts to LIBOR and other applicable rates.

STWD management estimates interest income will drop to -$53,416,000 in response to a 100bp drop in LIBOR, which will likely be offset by decreasing debt interest expenses, which management paints off as very likely to have an accretive effect on diluted EPS. This implies that STWD’s debt expenses are more sensitive to interest rate changes than its interest income, but how is that possible given a REITs’ nature of borrowing at low rates to capture interest rate spread? Whatever the case, future interest rate cuts will act dominantly as a revenue headwind – and potentially a catalyst for my investment thesis.

Like all mREITs, STWD’s profits depend on the interest rate spread between the short term rates the company uses for financing and the higher yields of mortgage loans and mortgage-backed securities. The classical problem with this business model is the mREIT’s exposure to yield curve inversion – when short-term rates drop lower than long-term rates, effectively turning revenue of STWD’s loans and REIS segments negative. While the company’s 2.7x debt/equity ratio is low for a REIT, we nevertheless cannot forget that the ratio acts like a multiplier. For example, as of September 30, 2019, STWD’s available-for-sale RMBS holdings come with a weighted average spread between repo/30 yr mortgage rates of 1.24%, which, when multiplied by 2.7x debt-to-equity, results in an effective spread of 3.35%. Because STWD’s portfolio is incredibly complex, it’s difficult to estimate the exact risks associated with inverted yields on every interest rate spread for every type of asset STWD owns. But this risk exists, and should be a major cause of concern given the current uncertainty present in the domestic and global macroeconomic context. S&P Global Ratings estimated recessionary risk at 30%-35% in the next 12 months at the end of September this year. If history tells us anything, there’s also a 30%-35% for a yield curve inversion in the next 12 months. 

In addition to STWD’s exposure to changing interest rates, the company faces a stagnating mortgage and housing market. After a weak start to the year, the housing market gained some momentum in the summer but it is unclear if that will prove sustainable. The pace of existing home sales accelerated in July and August only to fall back in September, according to the National Association of Realtors. The average 30-year fixed mortgage rate rose 7 basis points to 3.96% from 3.89% a week ago. Unwavering mortgage rates, in addition to a shortage of housing, are causing concern among economists, even though the 30-year rate has decreased some 100bp y/y. The current state of the housing market will play directly into STWD’s ability to originate new loans and populate properties. 

Given that 83% of the current loan portfolio is first-time loans, STWD’s loans segment is very dependent on the state of the consumer as a part of the economy and the housing market. Economic slowdowns tend to drag the first-time mortgage market into the mud, which would mean lower commercial lending revenue. As for the Property segment, in the 9 months between December 31, 2018 and September 30, 2019, the occupancy rate has fallen among most of the property portfolios that STWD own, with the most startling drop occurring in STWD’s Multifamily-residential Ireland portfolio – a drop from 100% to 81% in 9 months. This drop correlates to this year’s rising housing costs driven by shortages of affordable housing along with a global economic slowdown. 

In my research, I have encountered resources deterring consumers from taking long-term mortgages at times of recession, since rising rates after the recession can increase your risk for default. It is possible that home and business owners are deterred from taking mortgages given the current uncertainty among interest rates and the economy. Basically, a recession would produce deep, structural adverse effects among the real estate markets that could potentially disrupt STWD’s ability to generate revenue.

Lastly, I would like to discuss STWD’s dividend unsustainability as a result of poor/mediocre fundamentals.

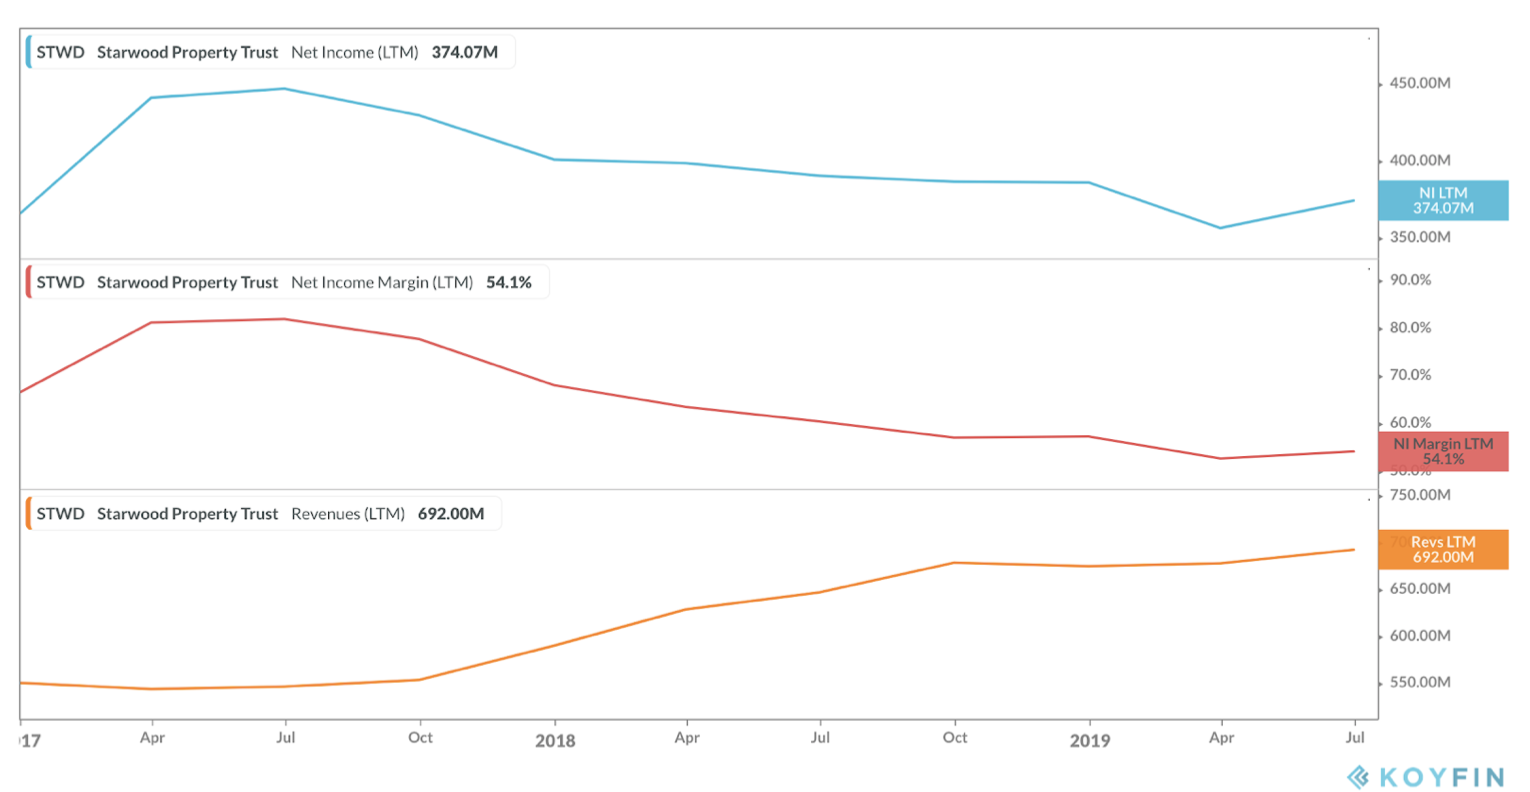
In the graph above, we can observe that while revenue has been increasing over time, the company’s net income margins and net income have been trailing. This company is a case where increasing revenues doesn’t tell the whole story; STWD’s EPS has fallen roughly 7% per year over the last five years, but the company has lifted its dividend 17% per year on average. Its high payout ratio of 142% last fiscal year (FY18 net income/share = $1.42, dividends per share = $1.92) raises concerns that the company’s dividend yield is unsustainable and increases the likelihood for dividend cuts in the future. The company’s bleeding actually matches STWD’s decreasing cash and cash equivalents, suggesting that the high dividends may have been partially funded by its cash reserves. 

Dividend cuts, especially from a REIT, will make the stock less attractive to investors, prompting less buying and more selling of STWD shares, which would drive the price per share lower, supporting the investment thesis. 

Valuation
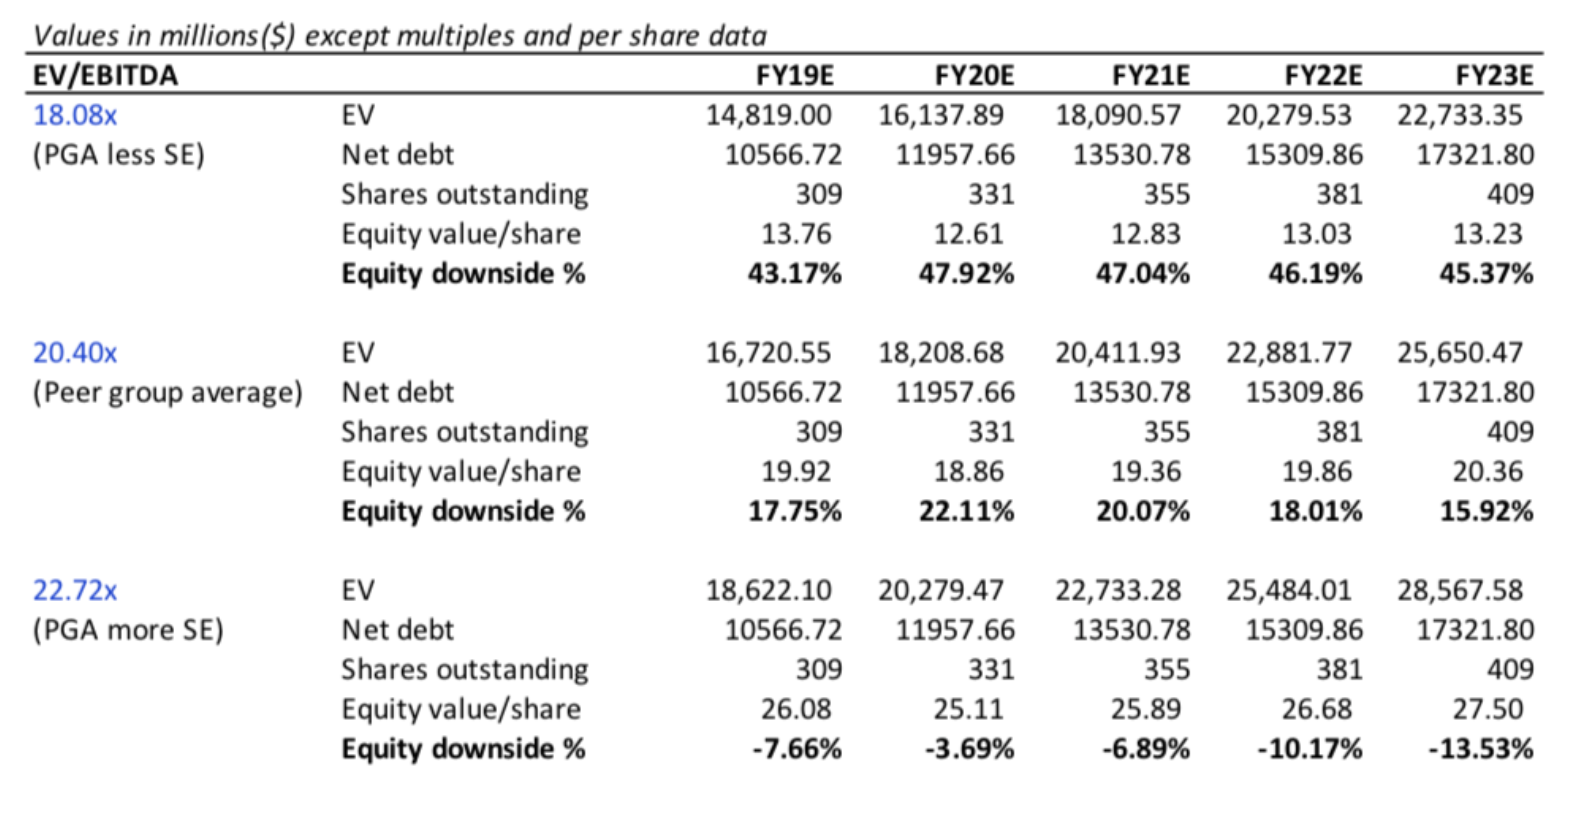
I used peer universe median EV/EBITDA multiple to complete valuation by projecting STWD EBITDA to FY23 and calculating equity value per share based on forecasts. Some key assumptions include: peer group average EV and EBITDA increase proportionally through FY23E, consensus estimates for EBIT for FY19-20, and average EBIT growth rates from then until FY23, and conservative increases in debt at 13% CAGR. Positive equity downside indicates percentage decrease from the current price per share of $24.22. Assuming the company’s multiple compresses to the peer group average, there is a potential profit opportunity of roughly 16% through FY23.

Risks
Better than expected earnings Q4 could threaten the investment thesis. Overperformance could trigger investor confidence in the stock and decrease the likelihood of dividend cuts, increasing price-per-share.
Better than expected economic status could increase confidence in the housing and mortgage markets and overall markets.
Markets price in a 2.1% chance of a rate hike within 12 months of December 2019.
Investors should be cautious when shorting around the ex-dividend date, which could see increased volatility in share prices.

Catalysts
While it is unlikely that the Federal Reserve will cut interest rates for the third time this year in the FOMC December meeting, it remains highly possible that the market may be seeing rate cuts early next year.
Economic data is a major focus of the stock market, and given poor conditions in geographical loans such as the Eurozone, as well as uncertainty in the United States, STWD’s global portfolio may become collateral damage in a global economic downturn. If/when the dividend yield is lowered by management, the price-per-share will likely decline.


Pedaling Out of Business

By Lily Warendorf

Despite naming every blatantly obvious attribute of their company, Peloton lacks one significant attribute: profitability. Although not being profitable does not raise red flags for investors in high growth companies like Peloton, it’s unclear path to profitability leads us to short Peloton. While Peloton’s subscribers think they are riding into the future, the company itself does not appear to be heading that way. 

How Peloton Works:

Peloton is an interactive fitness company. They sell treadmills and stationary bikes attached with a screen that plays a live fitness class while you are working out. It is similar to a Soul Cycle class with high energy and loud music, but in the comfort of your own home. The products themselves are not cheap with the bike costing $2,245 and the treadmill $4,295. However, expenses don’t stop there. In order to even access the live classes (the distinguishing feature which makes this company unique) you have to pay an additional $39 a month to access every live and on-demand class on your devices. However, if these expenses seem too high, Peloton has released an app that requires a monthly fee of $12.99 that includes live exercise classes such as yoga, running, cycling, and strength from your device. The app is separate from the membership and does not require ownership of any Peloton machines. 

Risks:

It is true that those who own a Peloton will most likely speak positively about their fitness experience with the company, the high prices are hindering the company from the massive growth they talk about. The high price may result in a limited addressable market for the product and consumers instead would use a bike at Planet Fitness for $10 a month or go to a cycling class. Although one Soul Cycle class is relatively expensive and can range anywhere from $30-$40, it is much less financially binding than a Peloton machine. You could buy around 64 Soul Cycle classes for the price of one Peloton bike. While the payment on a Peloton would allow for unlimited rides, 64 rides is a lot and there is a good possibility either you could become uninterested in cycling within that period or you could prefer the classes in studio as opposed to riding alone at home. All things considered, the price of the products deter a lot of potential consumers and will ultimately cause growth to slow. While I do believe having a Peloton would be convenient, as a consumer in the industry, I see the alternatives as a better option. 

The potential for Peloton to overestimate the rate of growth is important as they have overestimated anticipated sales for the December and January quarter much higher than the estimates of analysts.  Peloton expects sales between $410 and $420 million in December in contrast to analysts’ expectation of $385 million. Peloton expects around $1.5 billion of sales in January, while analysts expect $1.35 billion. It is valid to say that Peloton might be a little too optimistic about their performance. 

Peloton is also facing a $300m lawsuit against around 1,000 unlicensed songs. They are accused of using music producers’ songs without having synchronization licenses. After the lawsuit, customers have been complaining of the music quality. If music quality is an area of weakness for the company, the lack of music can pose a risk to sales, as the music and interactive aspect of the company is what makes it unique. When fewer people want to use Peloton to work out, less people will buy or subscribe, and again growth will slow. 

Financials:

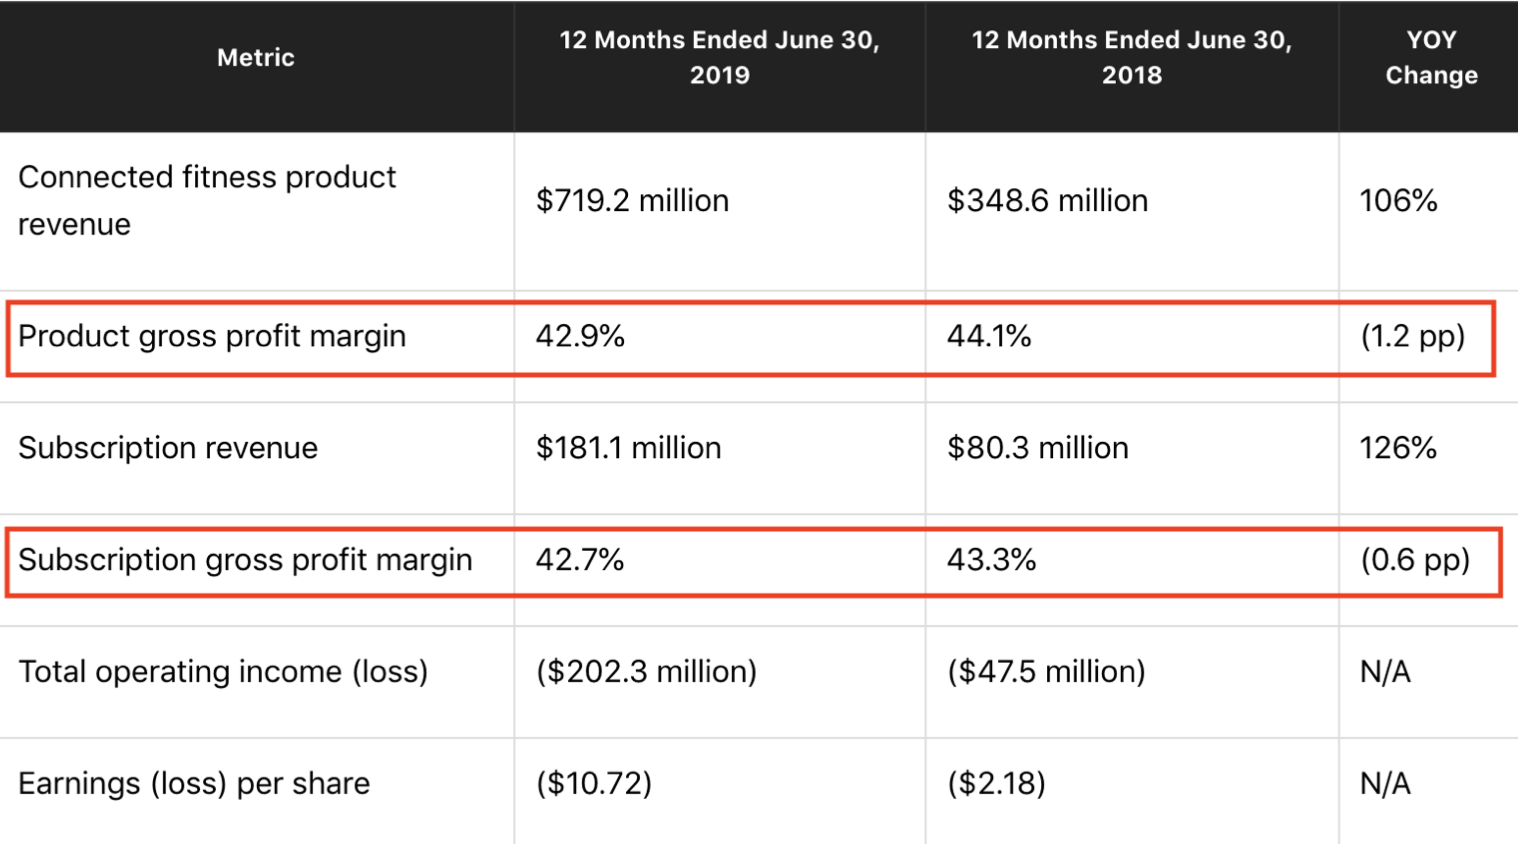
Peloton’s revenue is not a problem. It is increasing substantially year over year. It is the declining gross profit margins that raise concern. Both the product and subscription profit margins are decreasing. The product gross profit margin declined from 44.1% to 42.9% from 2018 to 2019 and the subscription gross profit margin decreased from 43.3% in 2018 to 42.7% in 2019. These declining gross profit margins raise a large concern about future profitability. 

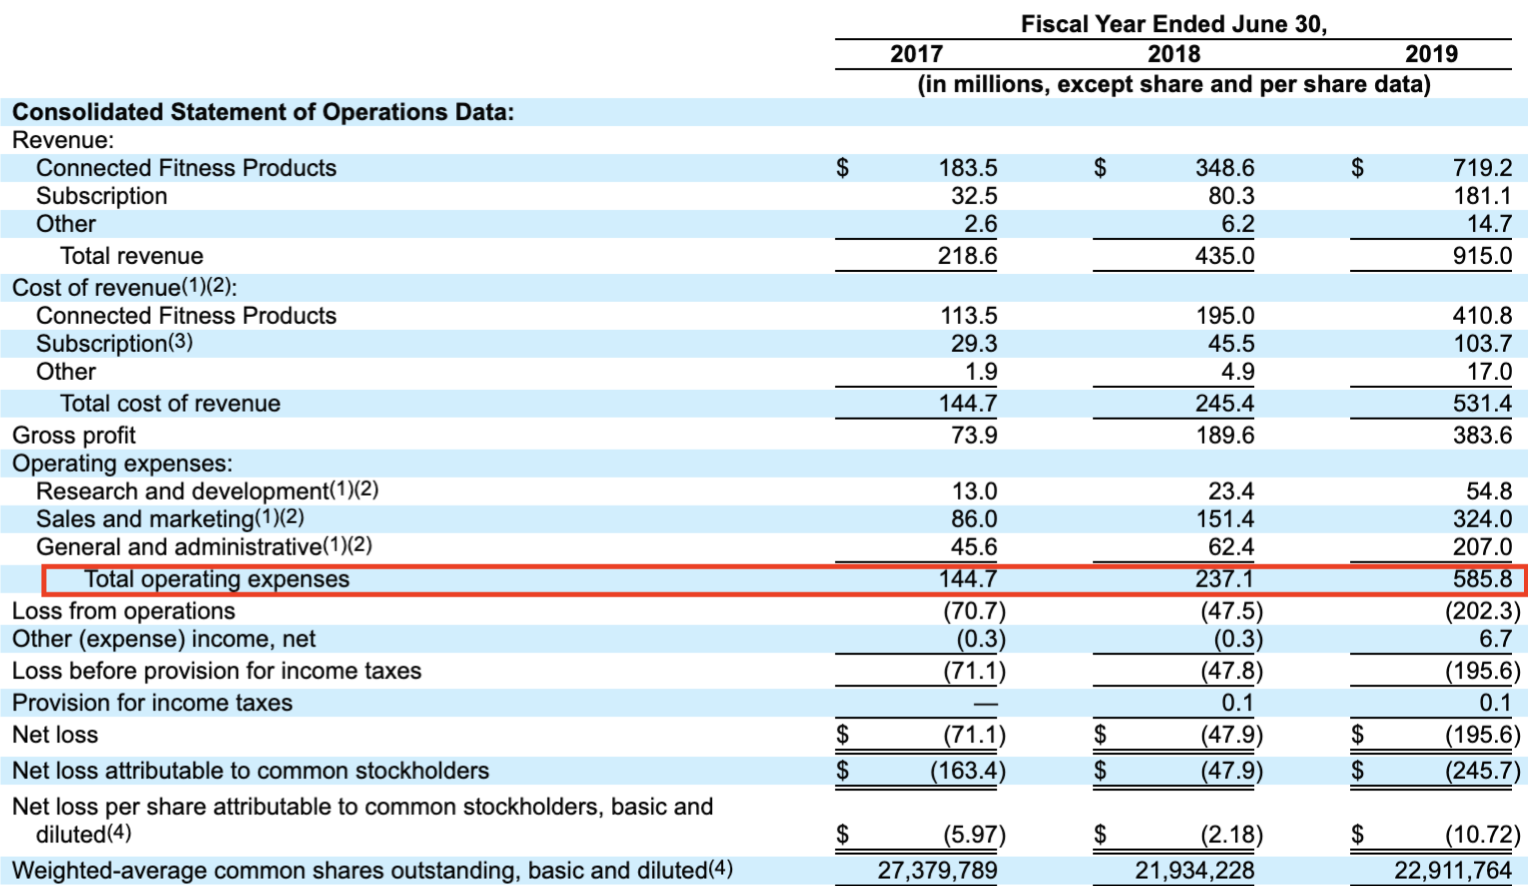
Operating Expenses are another area of concern. They have increased at an exponential rate over the last three fiscal years. When looked at more closely, there is more than a 200% increase in General and Administrative costs from 2018 to 2019. The company is not spending its money in the right places. 

Research and development is a specific area in which Peloton is lacking. In the 2019 fiscal year Peloton only spent $54.8 million on research and development as opposed to $324 million on sales and marketing and $207 million on general and administrative costs. The more the company grows, the more money is lost due to the increasingly high operating expenses with an exception for research. 

Another notable area of concern is as revenues grow exponentially into the positive, profits go exponentially into the negative. Peloton also boats a 95% retention rate, which is high, but does not promise a profitable future. In order for the revenue to overcome losses and generate earnings, the company has to sell as many if not more products or subscriptions. Of all the products that were connected to a membership (around 577,000 in total), 92% of them kept the membership subscription. Again, while high, does not justify or compensate for the amount of money spent elsewhere. 

Our Opinion: 

While Peloton has an attractive business idea, it does not mean that the company itself is worth investing in. The high prices seem not to be too much of a deterrent to customers, but the company has significant risks and is not spending their money in the right way. If the company is looking to grow, it needs to spend less on general and administrative costs and focus more on research and development for new products and a larger consumer base. Despite, CEO John Foley’s claim that they are sacrificing profitability for growth, the potential for growth is not evident enough to outweigh their unclear path to profitability. 


When Life Gives You (Lulu)lemons, Buy LULU Shares 

By Saamia Khan

Back in 1998, Lululemon Athletica founder and former CEO Chip Wilson attended a yoga class where inspiration struck. Coining the term “yoga pants,” Wilson created a company based on women’s yet-to-be-discovered need for a comfy pants. Fast forward 20 years, yoga pants and athleisure as a whole have skyrocketed in popularity, reflecting the changing American fashion landscape. In 2014, teens preferred elastic-waistband pants, overtaking the ever-popular pair of jeans. Athleisure as a whole has grown to a massive $167B industry, and will take up an even larger portion of clothing sales as the shift in preferences continues. 

Since its founding in 1998, Lululemon has established a total of 460 stores, mainly in the U.S. and Canada. It has evolved from selling just yoga pants to becoming an icon for all types of athletic wear, outerwear, and shoes (partnering with Athletic Propulsion Lab) for women, men, and girls. Recently, they launched a new line (“Lab”), a high-end streetwear separate brand with a price range of $80-$500 per item. With its $100 leggings feeding into nearly $3.3B of revenue in 2018, LULU stock has been gaining significant traction in the investment world, especially over the past year. With an EPS of $4.51, the stock’s recent high of $229.65 on November 29th is a more than 100% increase since its 52 week low of $110.71. 

While recognizing it does not trade cheaply, we believe Lulu is undervalued as the company sets itself apart with its tremendous yet realistic growth opportunities. LULU is a buy. 

Three-Pronged Approach for a 5-year plan (“Power of Three”)

Lululemon has three main target areas that feed into its optimistic mid-teens revenue growth numbers: an expansion into the international arena, increasing menswear sales, and doubling online sales. 

1. International Growth: 

Lululemon plans to greatly expand in Europe and Asia by 2024. The Asian market is one that Lululemon has yet to crack, and the next 5 years will be an important pivot to a greater global presence. The company currently operates 29 stores in China, and expects to open an additional 55 by 2024. In Europe, Lululemon has 12 stores and aims to open another 40 in the next 5 years. Overall, the company aims to have a total of 670 stores worldwide by 2024, a significant increase from its current 460.

2. Menswear

Though initially catering only to women, Lululemon expanded its offerings to men in 2015. Since its menswear launch, the company has struggled with the issue of being recognized as a dual-gendered brand. However, in recent quarters, the line has kicked off following the launch of their most popular men’s item, the ABC pant. Menswear sales increased by 28% in Q2 2019. The line is poised to continue its expansion in the coming years, and is set to more than double in sales in the next two years with the help of an ambitious marketing strategy. In the words of COO Stuart Haselden: “It’s growing faster than our women’s business.”

3. Online Sales

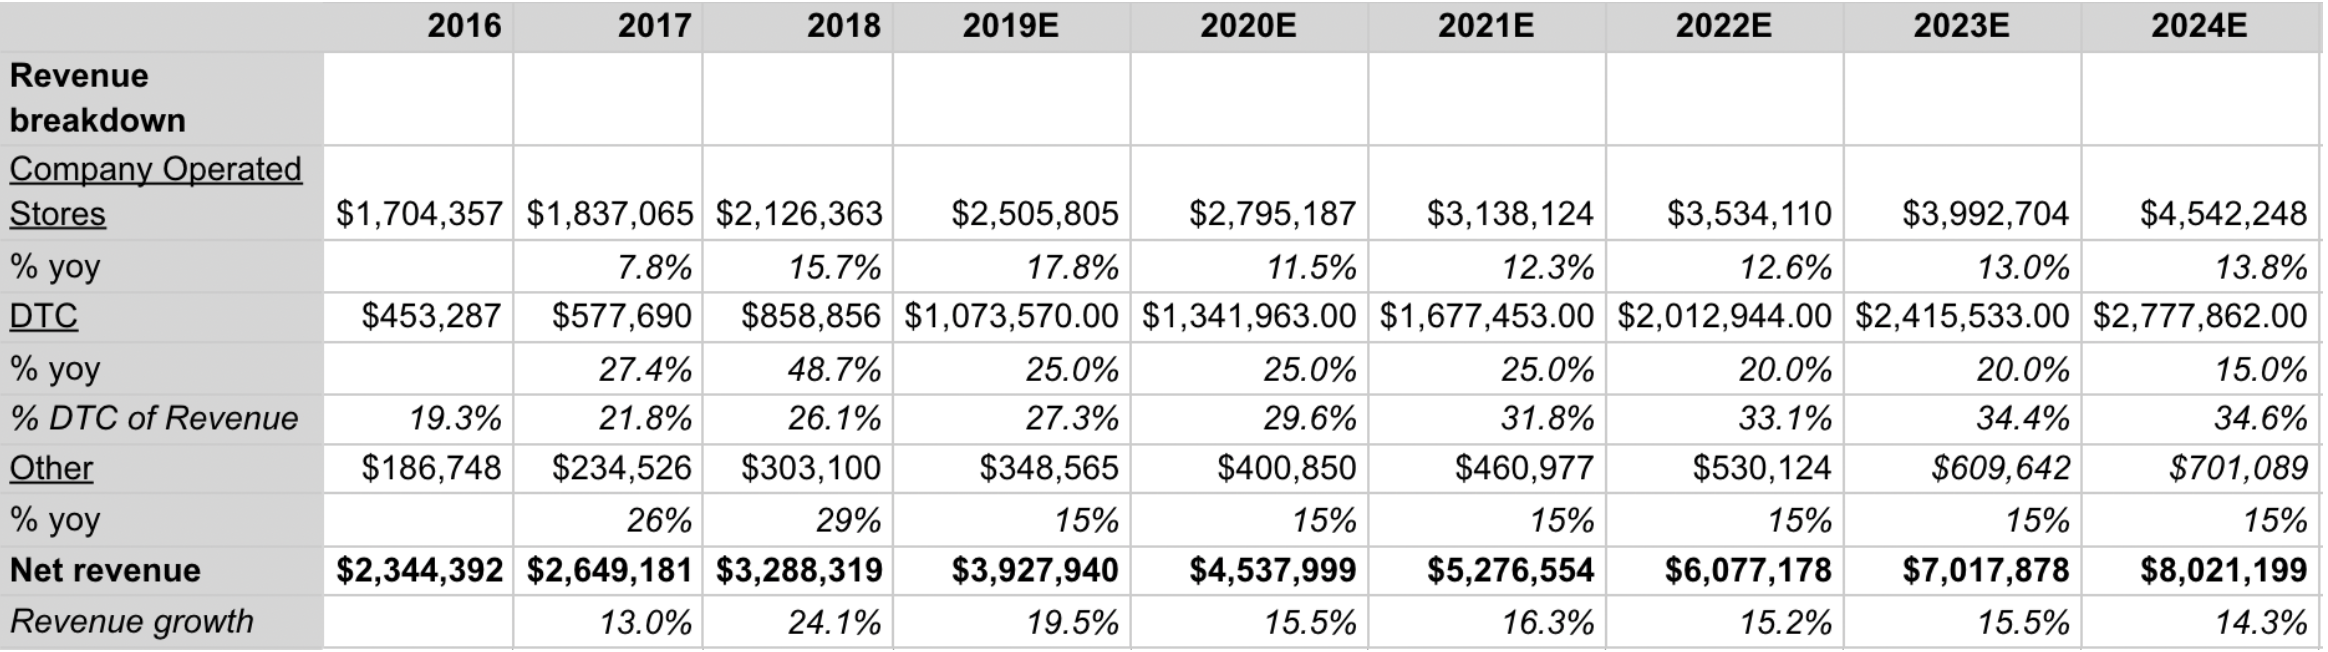
Lululemon has projected that direct-to-consumer (DTC) sales will at least double by 2024, a reasonable target given the company’s ability to drive online traffic in recent quarters. Online sales were up nearly 50% in the past year. In terms of profitability, online sales eliminate a plethora of costs between manufacturing and delivery to the consumer, hence allowing for margins of over 40%, compared to ~20% with in-store sales. These increased margins will help power overall company margins and offset costs in other areas. 

—

 In considering this three-pronged approach, it is apparent that Lululemon Athletica is exploring new avenues for revenue growth, having only just commenced its worldwide expansion. We assume a consistent revenue stream for each store opened until 2024 based on current figures. We also expect online sales to continue its growth in the double digits and subscription-based revenue growth of 15% per year (Other). Putting the above three revenue avenues together, we predict that Lululemon is poised for consistent revenue growth in the mid-teens through 2024. 

Just a Trend? On Brand Strength and Loyalty.

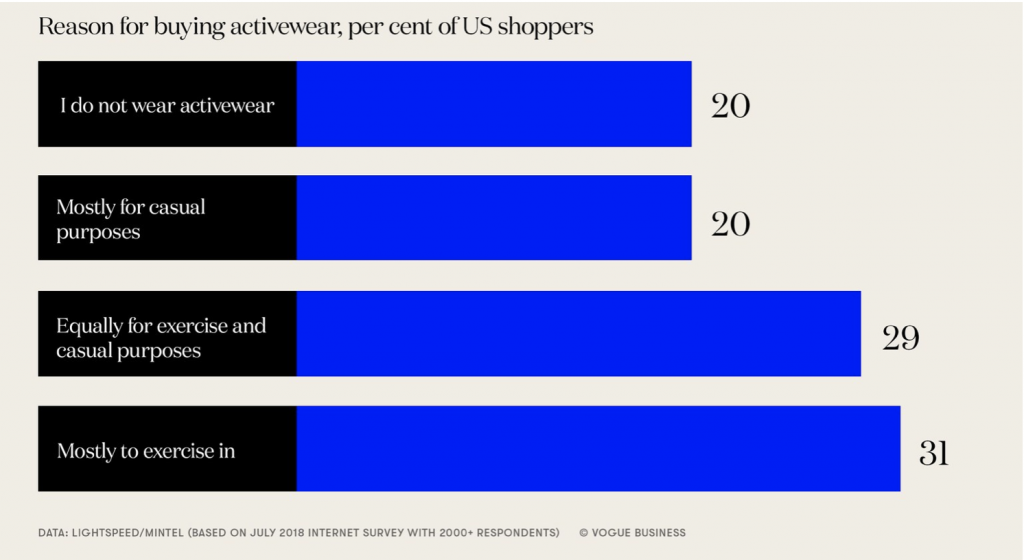
Lululemon’s projected success detailed above is contingent not only on the attraction of its products, but on the general success of the athleisure industry as a whole. There is a general push towards “wellness,” and buying goods that feed into this mindset. In fact, a growing percentage of Americans buy activewear not just for athletic activities, but as everyday wear.

Images from Lululemon’s experiential store in Chicago offering smoothies and yoga classes, reflective of the company’s push to integrate customers into a larger ecosystem.

Moreover, Lululemon has emerged from its position as a mere retailer. It is no longer a brick-and-mortar shop where purchasing athletic gear is the only appeal. First, the Lululemon brand is especially prominent and the name-value brings with it a host of advantages, a feature its customer base is most definitely aware of. The distinct reflective horseshoe logo has become a recognizable symbol of wellness and athleticism. As mentioned above, in addition to in-store and direct-to-consumer sales, a third portion of revenue comes from subscriptions. Lululemon has recently made a large push towards incorporating customers into a greater ecosystem, offering yoga classes and membership to running clubs. Its new paid loyalty program, similar to a program that current Lululemon CEO Calvin McDonald implemented during his tenure as CEO at Sephora, ensures customers return for limited-edition products, free expedited shipping, and other perks. As of Q3 2019, the program has had positive “results [that] have been well above our expectations going in very favorable,” according to McDonald. They have teamed up with SoulCycle to offer custom-made gear, solidifying its name in the high-end athletic space. 

From Lululemon’s website: a look into its differentiating technology

Lululemon also sets itself apart due to its technology. The company’s research and development lab within its headquarters, Whitespace, is made up of around 50 employees that include scientists and physiologists. Lululemon’s quality goods contribute to the company’s strong ability to retain customers while demanding a high price point.

Strong Financials

Lululemon has a great balance sheet, especially for a more than 20-year-old company, the main takeaway being that they have no long-term debt. With continued revenue growth and higher margins, we expect cash flow to sustain and reflect in shareholder’s equity.

Comps

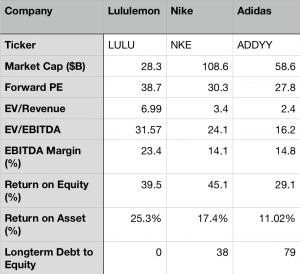
In comparison to its largest competitors, Nike and Adidas, Lululemon certainly seems to be the most overvalued. Despite its high EV/Revenue and EV/Revenue numbers, Lululemon’s small market cap in comparison to Nike and Adidas is indicative of its immense growth opportunities. Moreover, its return on asset figure is higher than competitors, an attractive quality for growth valued company.

Risks: A Discussion

I will address a few potential risks to Lululemon’s revenue growth.

Tory Burch’s luxury athletic wear store, Tory Sport, on Fifth Avenue

A main worry in the athleisure industry is the low barriers to entry and the resulting competition. Seeing Lululemon’s high margins, it is an attractive industry for outsiders. In recent years, Nike and Adidas have greatly expanded their women’s lines in an effort to compete with Lululemon. Many higher-end names such as Tory Burch alongside streetwear brands such as KITH have also waded into the athleisure space. However, as discussed earlier, Lululemon has and continues to integrate customers into a larger Lulu ecosystem, making Lululemon more than just a retailer. At the same time however, changing preferences and trends could potentially have large impacts on Lulu’s profitability. 

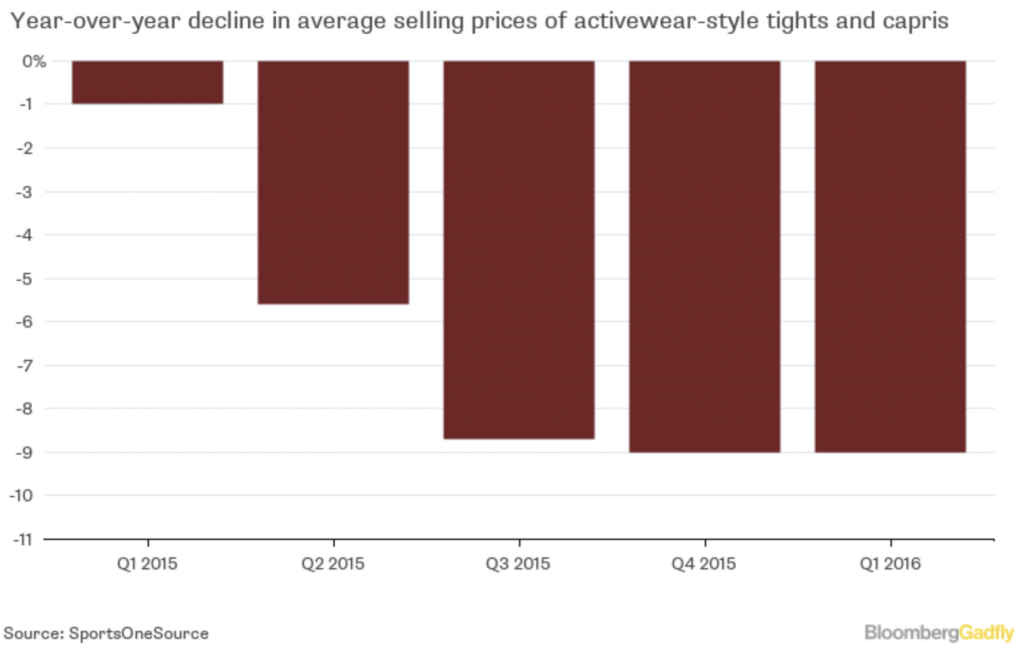
Another concern with low barriers to entry is the possibility of a drop in prices of similar goods. For the past few years, Lululemon has been able to sell nearly all of its inventory at no discount, due to a deliberate strategy to lower supply and entice customers. However, in recent quarters, the company’s sale section has been expanding, and many so-called “less-trendy” leggings go for as low as $60. Whether this new pricing strategy feeds Lululemon’s profitability is yet to be determined.

Given the current political climate, the possibility of U.S-China trade tensions affecting profitability is a valid concern. However, in its most recent quarterly report, Lululemon claims that only 6% off its total inventory would be affected by import tariffs; it has recently pushed to diversify its manufacturing bases, and most of which now occurs in Vietnam and Cambodia. 

Conclusion

Lululemon Athletica is a company with strong financials and an even stronger growth potential. By tapping into yet-to-be-explored markets, we expect to see Lululemon continue its emergence as a worldwide player. Its unique ability to innovate and dedication to creating quality products coupled with an overall shift towards comfortable clothing will allow Lulu to sustain its high customer retention rates.