Starwood Property Trust Inc (STWD)

By Kyle Sung   

Company Overview
Starwood Property Trust (STWD) is a real estate investment trust focused around real estate and infrastructure. STWD is one of the largest loan originators of any institution, and currently provides commercial, residential and infrastructure loans. The company’s current portfolio of around 16 billion dollars contains 4 business segments: real estate lending, real estate investing and servicing, property, and infrastructure lending. 

Investment Thesis
I recommend shorting the stock because the company is overvalued compared to its peer group, it faces interest rate risk, recessionary risk (due to potential yield curve inversions and weak housing market), and dividend unsustainability. 

The company’s extensive investment in variable rate assets exposes it to significant interest rate risk. To put this risk into perspective, around $8 billion of STWD’s $10.3 billion loan portfolio is comprised of variable rate loans. The ratio decreases when considering the $8 billion of loans are all being held for investment, resulting in a ratio of 8/9th of loans are HTM (the $8 billion includes 6.7 billion in commercial loans, and 1.3 billion in infrastructure loans). Approximately 84.9% of RMBS and a tenth of CMBS’ that STWD reported under the fair value option are variable-rate. 

Given the adjustable-rate nature of commercial mortgages and housing loans, interest rates and the net asset values of STWD’s portfolio are directly related. Thus, as interest rates fall, the net asset value of STWD’s portfolio stands to fall. Given current economic standings, including the Sino-American trade war, low manufacturing numbers, housing, slowing job growth and business investment, it is extremely more likely that the Federal Reserve will cut rates rather than raise them in the near future.
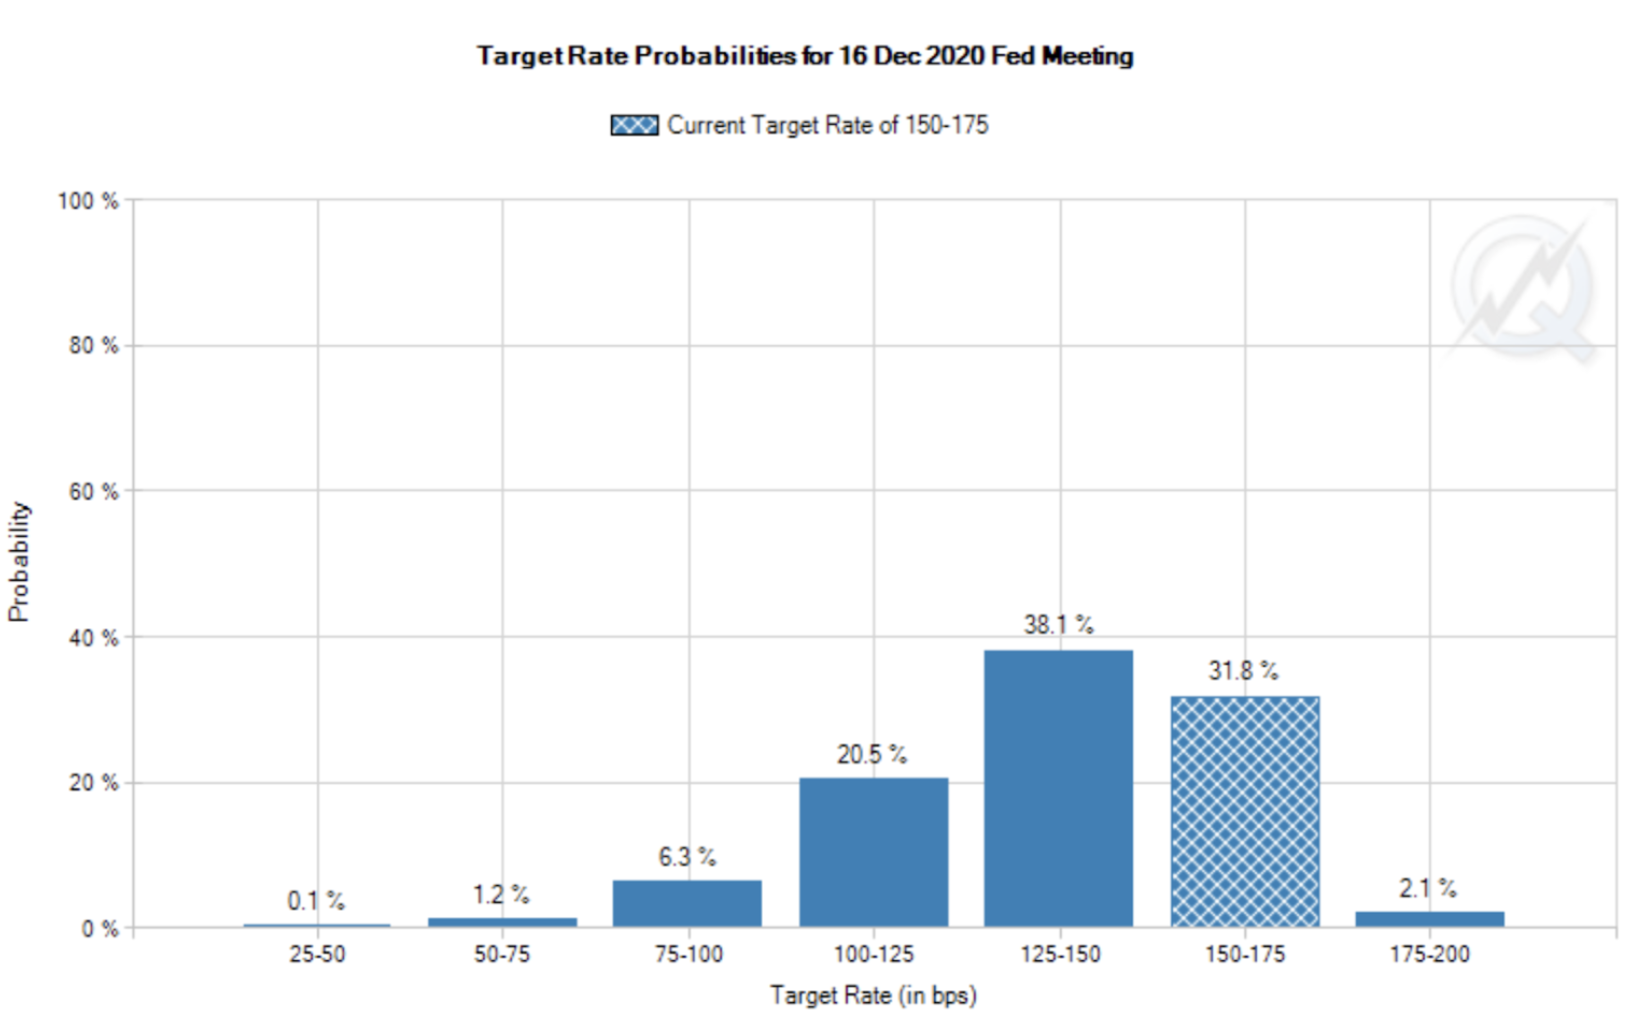
We can check the probabilities of future Federal Reserve rate cuts by looking at the Federal Funds Futures markets. According to a figure by CME Group (pictured above), the markets are currently pricing in a 66.2% chance of at least a 25bp rate cut, with only a 2.1% chance of a hike by the 2020 December FOMC meeting. 

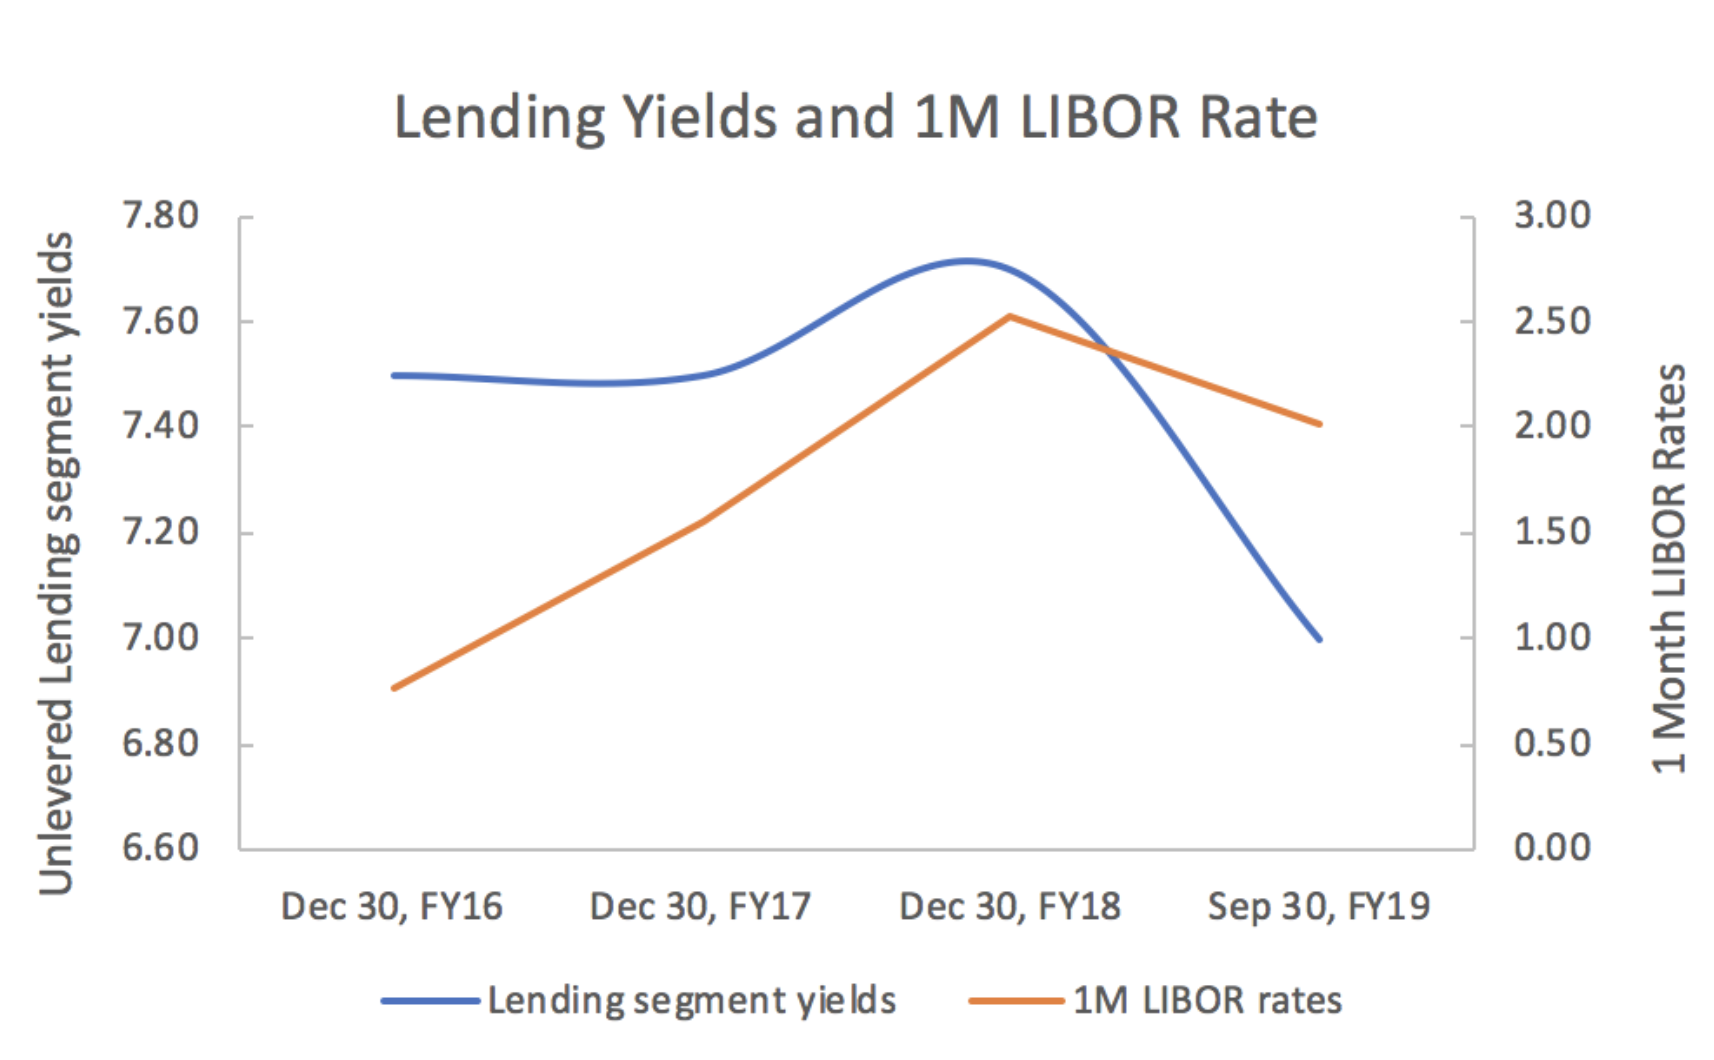
LIBOR rates have steadily climbed between 2015 and 2018. In FY18, STWD saw an increase of yields from FY17’s 7.5% to FY18’s 7.7% from its Commercial and Residential loans segment. The increase, while not overly substantial, was offset by compression of interest rate spreads in credit markets and a decrease in yields from fixed-rate residential loans. As seen in the figure below, there exists an observable, direct relationship between STWD’s loan yields and interest rates, and as the current global economic outlook worsens, we expect to see a decrease of yields across STWD’s Loans and REIS segments as a result of cuts to LIBOR and other applicable rates.
STWD management estimates interest income will drop to -$53,416,000 in response to a 100bp drop in LIBOR, which will likely be offset by decreasing debt interest expenses, which management paints off as very likely to have an accretive effect on diluted EPS. This implies that STWD’s debt expenses are more sensitive to interest rate changes than its interest income, but how is that possible given a REITs’ nature of borrowing at low rates to capture interest rate spread? Whatever the case, future interest rate cuts will act dominantly as a revenue headwind – and potentially a catalyst for my investment thesis.

Like all mREITs, STWD’s profits depend on the interest rate spread between the short term rates the company uses for financing and the higher yields of mortgage loans and mortgage-backed securities. The classical problem with this business model is the mREIT’s exposure to yield curve inversion – when short-term rates drop lower than long-term rates, effectively turning revenue of STWD’s loans and REIS segments negative. While the company’s 2.7x debt/equity ratio is low for a REIT, we nevertheless cannot forget that the ratio acts like a multiplier. For example, as of September 30, 2019, STWD’s available-for-sale RMBS holdings come with a weighted average spread between repo/30 yr mortgage rates of 1.24%, which, when multiplied by 2.7x debt-to-equity, results in an effective spread of 3.35%. Because STWD’s portfolio is incredibly complex, it’s difficult to estimate the exact risks associated with inverted yields on every interest rate spread for every type of asset STWD owns. But this risk exists, and should be a major cause of concern given the current uncertainty present in the domestic and global macroeconomic context. S&P Global Ratings estimated recessionary risk at 30%-35% in the next 12 months at the end of September this year. If history tells us anything, there’s also a 30%-35% for a yield curve inversion in the next 12 months. 

In addition to STWD’s exposure to changing interest rates, the company faces a stagnating mortgage and housing market. After a weak start to the year, the housing market gained some momentum in the summer but it is unclear if that will prove sustainable. The pace of existing home sales accelerated in July and August only to fall back in September, according to the National Association of Realtors. The average 30-year fixed mortgage rate rose 7 basis points to 3.96% from 3.89% a week ago. Unwavering mortgage rates, in addition to a shortage of housing, are causing concern among economists, even though the 30-year rate has decreased some 100bp y/y. The current state of the housing market will play directly into STWD’s ability to originate new loans and populate properties. 

Given that 83% of the current loan portfolio is first-time loans, STWD’s loans segment is very dependent on the state of the consumer as a part of the economy and the housing market. Economic slowdowns tend to drag the first-time mortgage market into the mud, which would mean lower commercial lending revenue. As for the Property segment, in the 9 months between December 31, 2018 and September 30, 2019, the occupancy rate has fallen among most of the property portfolios that STWD own, with the most startling drop occurring in STWD’s Multifamily-residential Ireland portfolio – a drop from 100% to 81% in 9 months. This drop correlates to this year’s rising housing costs driven by shortages of affordable housing along with a global economic slowdown. 

In my research, I have encountered resources deterring consumers from taking long-term mortgages at times of recession, since rising rates after the recession can increase your risk for default. It is possible that home and business owners are deterred from taking mortgages given the current uncertainty among interest rates and the economy. Basically, a recession would produce deep, structural adverse effects among the real estate markets that could potentially disrupt STWD’s ability to generate revenue.

Lastly, I would like to discuss STWD’s dividend unsustainability as a result of poor/mediocre fundamentals.
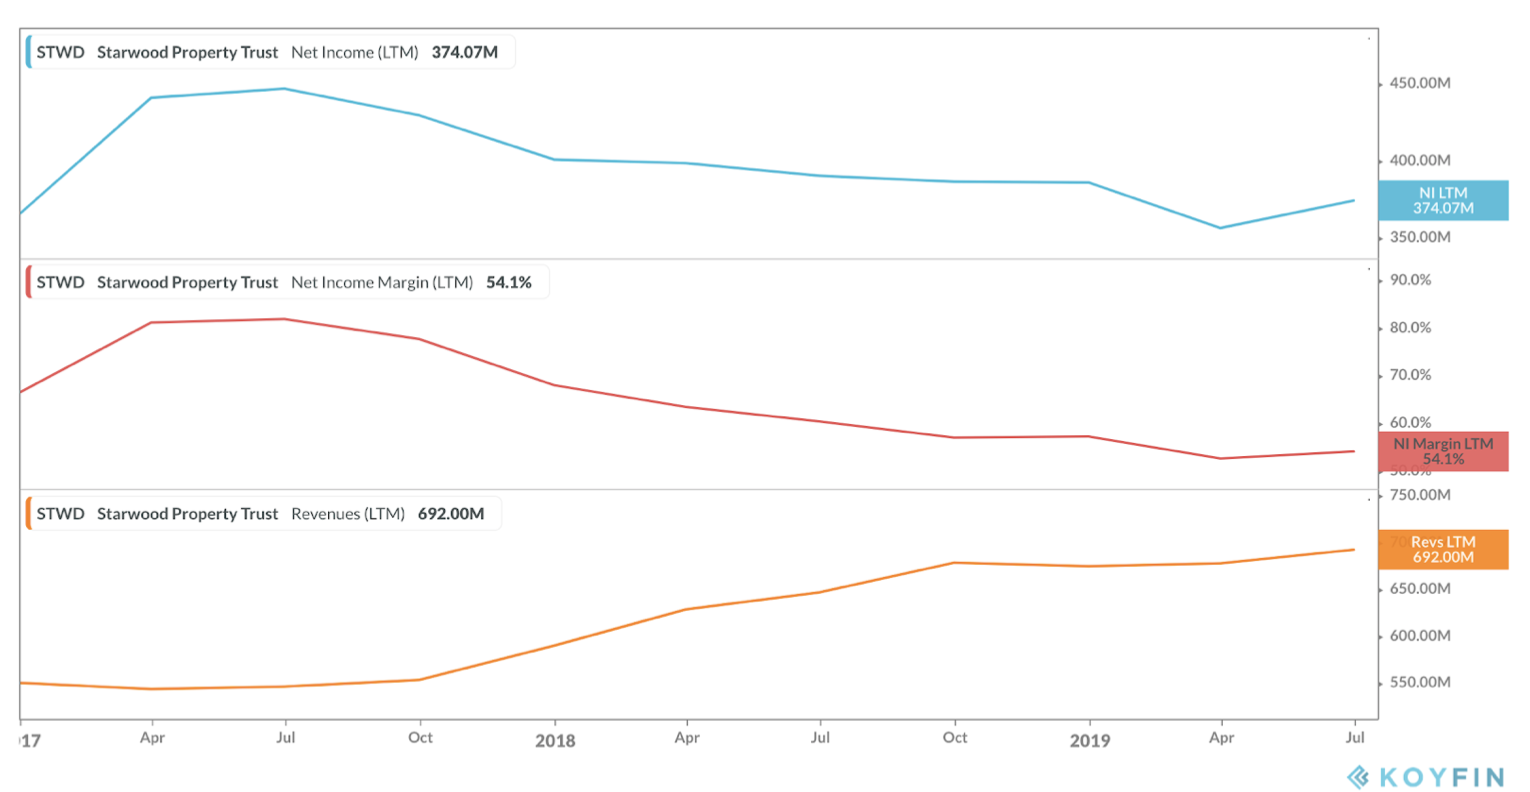
In the graph above, we can observe that while revenue has been increasing over time, the company’s net income margins and net income have been trailing. This company is a case where increasing revenues doesn’t tell the whole story; STWD’s EPS has fallen roughly 7% per year over the last five years, but the company has lifted its dividend 17% per year on average. Its high payout ratio of 142% last fiscal year (FY18 net income/share = $1.42, dividends per share = $1.92) raises concerns that the company’s dividend yield is unsustainable and increases the likelihood for dividend cuts in the future. The company’s bleeding actually matches STWD’s decreasing cash and cash equivalents, suggesting that the high dividends may have been partially funded by its cash reserves. 

Dividend cuts, especially from a REIT, will make the stock less attractive to investors, prompting less buying and more selling of STWD shares, which would drive the price per share lower, supporting the investment thesis. 

Valuation
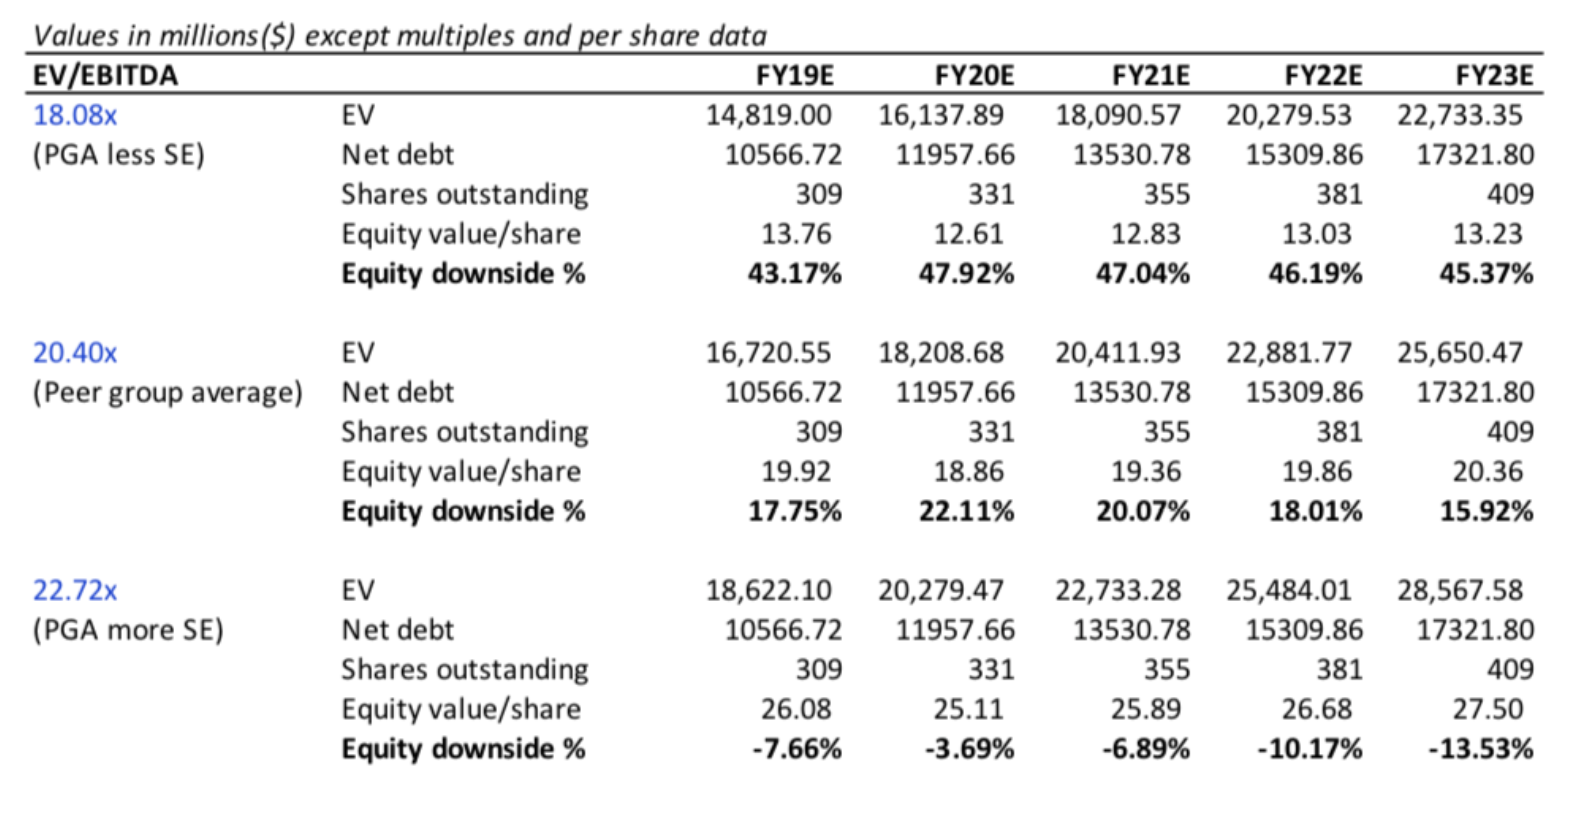
I used peer universe median EV/EBITDA multiple to complete valuation by projecting STWD EBITDA to FY23 and calculating equity value per share based on forecasts. Some key assumptions include: peer group average EV and EBITDA increase proportionally through FY23E, consensus estimates for EBIT for FY19-20, and average EBIT growth rates from then until FY23, and conservative increases in debt at 13% CAGR. Positive equity downside indicates percentage decrease from the current price per share of $24.22. Assuming the company’s multiple compresses to the peer group average, there is a potential profit opportunity of roughly 16% through FY23.
Risks
Better than expected earnings Q4 could threaten the investment thesis. Overperformance could trigger investor confidence in the stock and decrease the likelihood of dividend cuts, increasing price-per-share.
Better than expected economic status could increase confidence in the housing and mortgage markets and overall markets.
Markets price in a 2.1% chance of a rate hike within 12 months of December 2019.
Investors should be cautious when shorting around the ex-dividend date, which could see increased volatility in share prices.

Catalysts
While it is unlikely that the Federal Reserve will cut interest rates for the third time this year in the FOMC December meeting, it remains highly possible that the market may be seeing rate cuts early next year.
Economic data is a major focus of the stock market, and given poor conditions in geographical loans such as the Eurozone, as well as uncertainty in the United States, STWD’s global portfolio may become collateral damage in a global economic downturn. If/when the dividend yield is lowered by management, the price-per-share will likely decline.

 

Pedaling Out of Business

By Lily Warendorf

Despite naming every blatantly obvious attribute of their company, Peloton lacks one significant attribute: profitability. Although not being profitable does not raise red flags for investors in high growth companies like Peloton, it’s unclear path to profitability leads us to short Peloton. While Peloton’s subscribers think they are riding into the future, the company itself does not appear to be heading that way. 

How Peloton Works:

Peloton is an interactive fitness company. They sell treadmills and stationary bikes attached with a screen that plays a live fitness class while you are working out. It is similar to a Soul Cycle class with high energy and loud music, but in the comfort of your own home. The products themselves are not cheap with the bike costing $2,245 and the treadmill $4,295. However, expenses don’t stop there. In order to even access the live classes (the distinguishing feature which makes this company unique) you have to pay an additional $39 a month to access every live and on-demand class on your devices. However, if these expenses seem too high, Peloton has released an app that requires a monthly fee of $12.99 that includes live exercise classes such as yoga, running, cycling, and strength from your device. The app is separate from the membership and does not require ownership of any Peloton machines. 

Risks:

It is true that those who own a Peloton will most likely speak positively about their fitness experience with the company, the high prices are hindering the company from the massive growth they talk about. The high price may result in a limited addressable market for the product and consumers instead would use a bike at Planet Fitness for $10 a month or go to a cycling class. Although one Soul Cycle class is relatively expensive and can range anywhere from $30-$40, it is much less financially binding than a Peloton machine. You could buy around 64 Soul Cycle classes for the price of one Peloton bike. While the payment on a Peloton would allow for unlimited rides, 64 rides is a lot and there is a good possibility either you could become uninterested in cycling within that period or you could prefer the classes in studio as opposed to riding alone at home. All things considered, the price of the products deter a lot of potential consumers and will ultimately cause growth to slow. While I do believe having a Peloton would be convenient, as a consumer in the industry, I see the alternatives as a better option. 

The potential for Peloton to overestimate the rate of growth is important as they have overestimated anticipated sales for the December and January quarter much higher than the estimates of analysts.  Peloton expects sales between $410 and $420 million in December in contrast to analysts’ expectation of $385 million. Peloton expects around $1.5 billion of sales in January, while analysts expect $1.35 billion. It is valid to say that Peloton might be a little too optimistic about their performance. 

Peloton is also facing a $300m lawsuit against around 1,000 unlicensed songs. They are accused of using music producers’ songs without having synchronization licenses. After the lawsuit, customers have been complaining of the music quality. If music quality is an area of weakness for the company, the lack of music can pose a risk to sales, as the music and interactive aspect of the company is what makes it unique. When fewer people want to use Peloton to work out, less people will buy or subscribe, and again growth will slow. 

Financials:

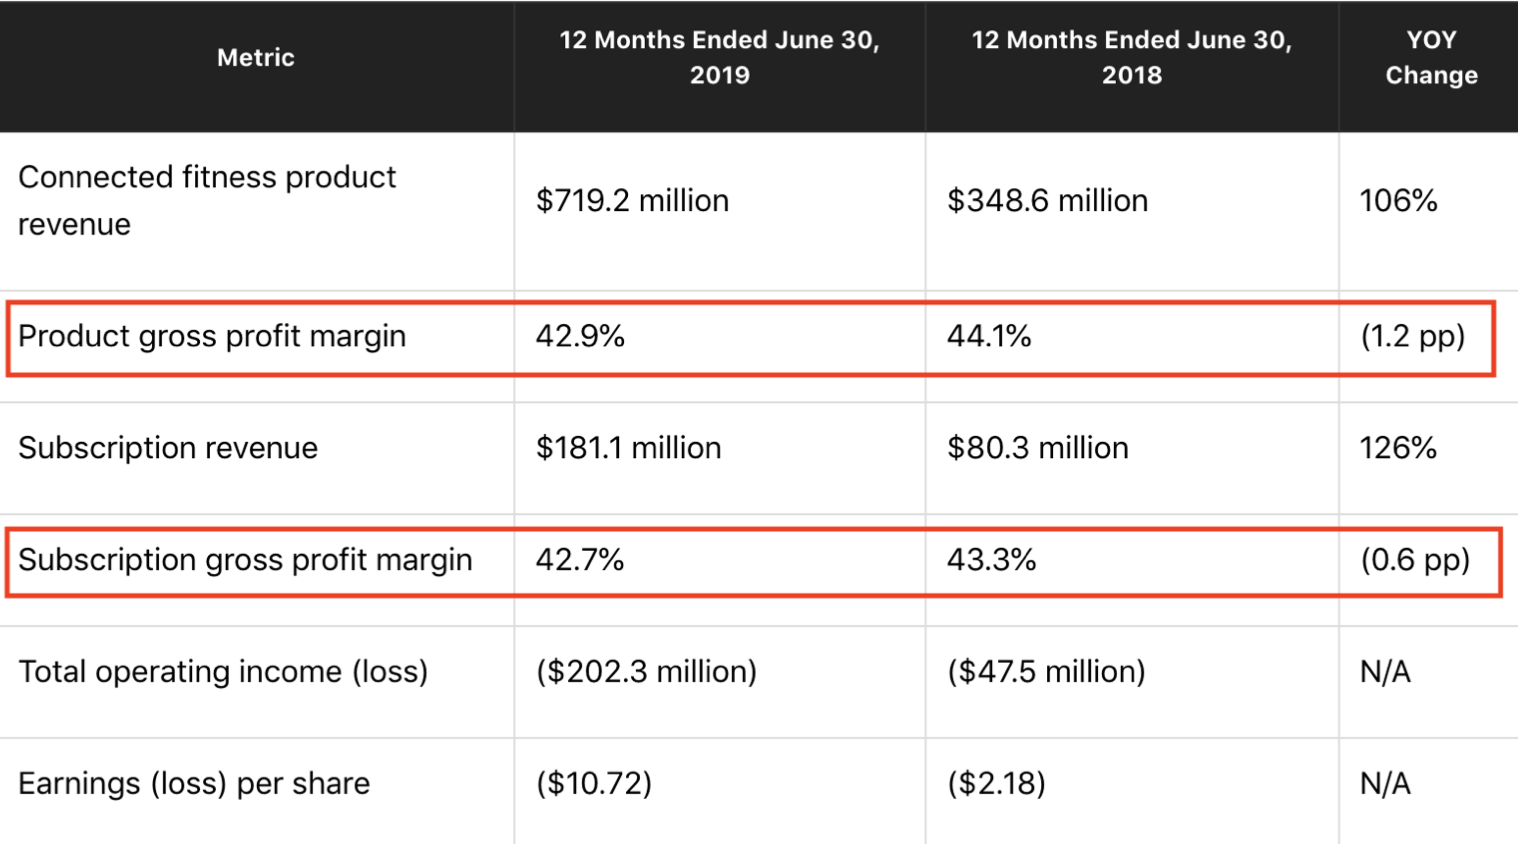
Peloton’s revenue is not a problem. It is increasing substantially year over year. It is the declining gross profit margins that raise concern. Both the product and subscription profit margins are decreasing. The product gross profit margin declined from 44.1% to 42.9% from 2018 to 2019 and the subscription gross profit margin decreased from 43.3% in 2018 to 42.7% in 2019. These declining gross profit margins raise a large concern about future profitability. 

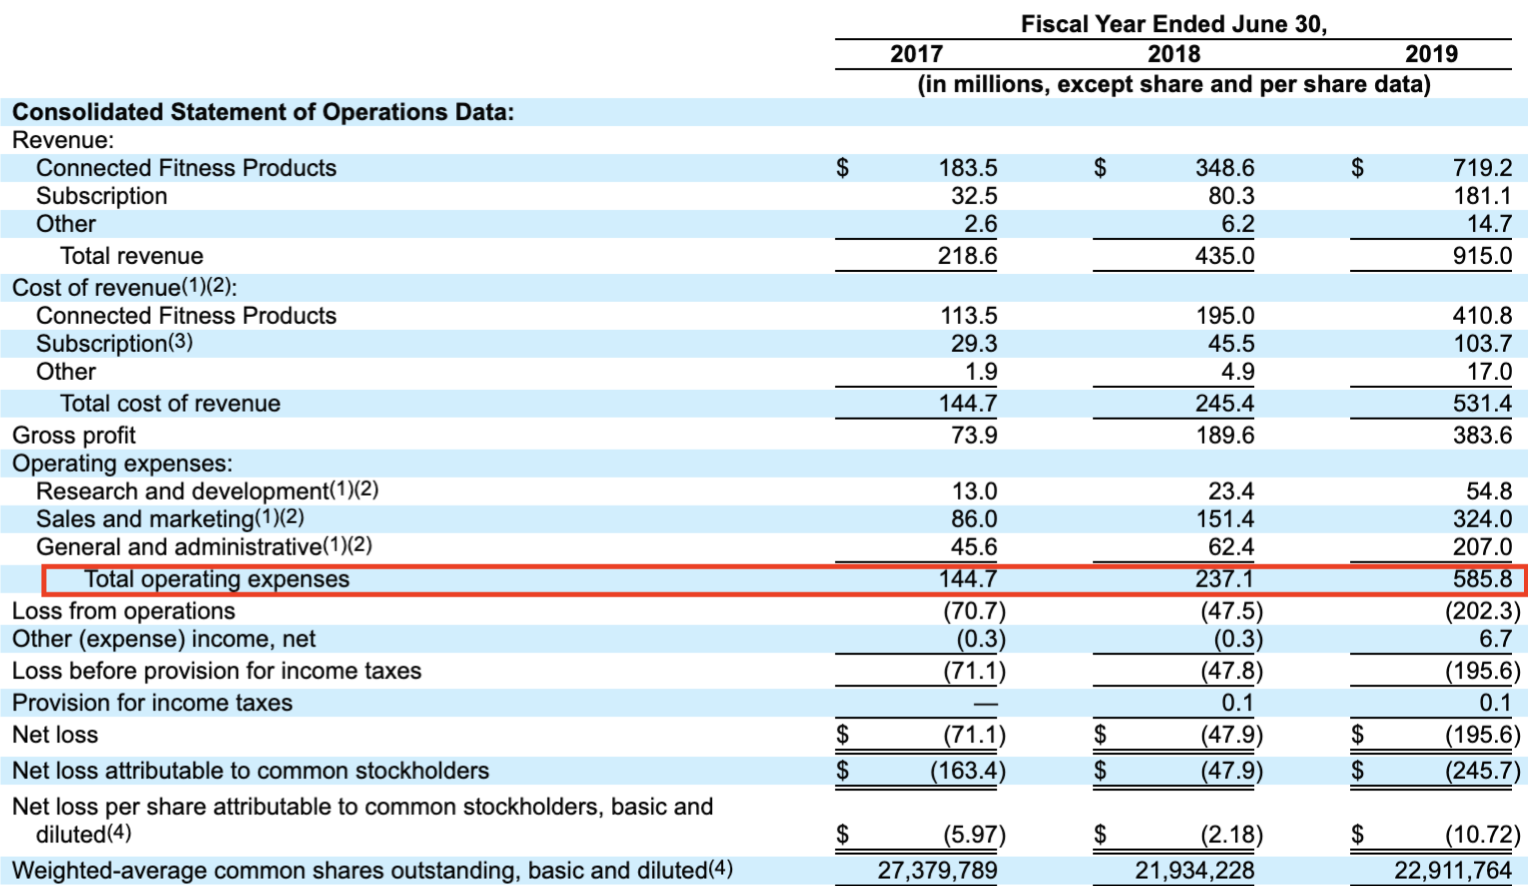
Operating Expenses are another area of concern. They have increased at an exponential rate over the last three fiscal years. When looked at more closely, there is more than a 200% increase in General and Administrative costs from 2018 to 2019. The company is not spending its money in the right places. 

Research and development is a specific area in which Peloton is lacking. In the 2019 fiscal year Peloton only spent $54.8 million on research and development as opposed to $324 million on sales and marketing and $207 million on general and administrative costs. The more the company grows, the more money is lost due to the increasingly high operating expenses with an exception for research. 

Another notable area of concern is as revenues grow exponentially into the positive, profits go exponentially into the negative. Peloton also boats a 95% retention rate, which is high, but does not promise a profitable future. In order for the revenue to overcome losses and generate earnings, the company has to sell as many if not more products or subscriptions. Of all the products that were connected to a membership (around 577,000 in total), 92% of them kept the membership subscription. Again, while high, does not justify or compensate for the amount of money spent elsewhere. 

Our Opinion: 

While Peloton has an attractive business idea, it does not mean that the company itself is worth investing in. The high prices seem not to be too much of a deterrent to customers, but the company has significant risks and is not spending their money in the right way. If the company is looking to grow, it needs to spend less on general and administrative costs and focus more on research and development for new products and a larger consumer base. Despite, CEO John Foley’s claim that they are sacrificing profitability for growth, the potential for growth is not evident enough to outweigh their unclear path to profitability. 


When Life Gives You (Lulu)lemons, Buy LULU Shares 

By Saamia Khan

Back in 1998, Lululemon Athletica founder and former CEO Chip Wilson attended a yoga class where inspiration struck. Coining the term “yoga pants,” Wilson created a company based on women’s yet-to-be-discovered need for a comfy pants. Fast forward 20 years, yoga pants and athleisure as a whole have skyrocketed in popularity, reflecting the changing American fashion landscape. In 2014, teens preferred elastic-waistband pants, overtaking the ever-popular pair of jeans. Athleisure as a whole has grown to a massive $167B industry, and will take up an even larger portion of clothing sales as the shift in preferences continues. 

Since its founding in 1998, Lululemon has established a total of 460 stores, mainly in the U.S. and Canada. It has evolved from selling just yoga pants to becoming an icon for all types of athletic wear, outerwear, and shoes (partnering with Athletic Propulsion Lab) for women, men, and girls. Recently, they launched a new line (“Lab”), a high-end streetwear separate brand with a price range of $80-$500 per item. With its $100 leggings feeding into nearly $3.3B of revenue in 2018, LULU stock has been gaining significant traction in the investment world, especially over the past year. With an EPS of $4.51, the stock’s recent high of $229.65 on November 29th is a more than 100% increase since its 52 week low of $110.71. 

While recognizing it does not trade cheaply, we believe Lulu is undervalued as the company sets itself apart with its tremendous yet realistic growth opportunities. LULU is a buy. 

Three-Pronged Approach for a 5-year plan (“Power of Three”)

Lululemon has three main target areas that feed into its optimistic mid-teens revenue growth numbers: an expansion into the international arena, increasing menswear sales, and doubling online sales. 

1. International Growth: 

Lululemon plans to greatly expand in Europe and Asia by 2024. The Asian market is one that Lululemon has yet to crack, and the next 5 years will be an important pivot to a greater global presence. The company currently operates 29 stores in China, and expects to open an additional 55 by 2024. In Europe, Lululemon has 12 stores and aims to open another 40 in the next 5 years. Overall, the company aims to have a total of 670 stores worldwide by 2024, a significant increase from its current 460.

2. Menswear

Though initially catering only to women, Lululemon expanded its offerings to men in 2015. Since its menswear launch, the company has struggled with the issue of being recognized as a dual-gendered brand. However, in recent quarters, the line has kicked off following the launch of their most popular men’s item, the ABC pant. Menswear sales increased by 28% in Q2 2019. The line is poised to continue its expansion in the coming years, and is set to more than double in sales in the next two years with the help of an ambitious marketing strategy. In the words of COO Stuart Haselden: “It’s growing faster than our women’s business.”

3. Online Sales

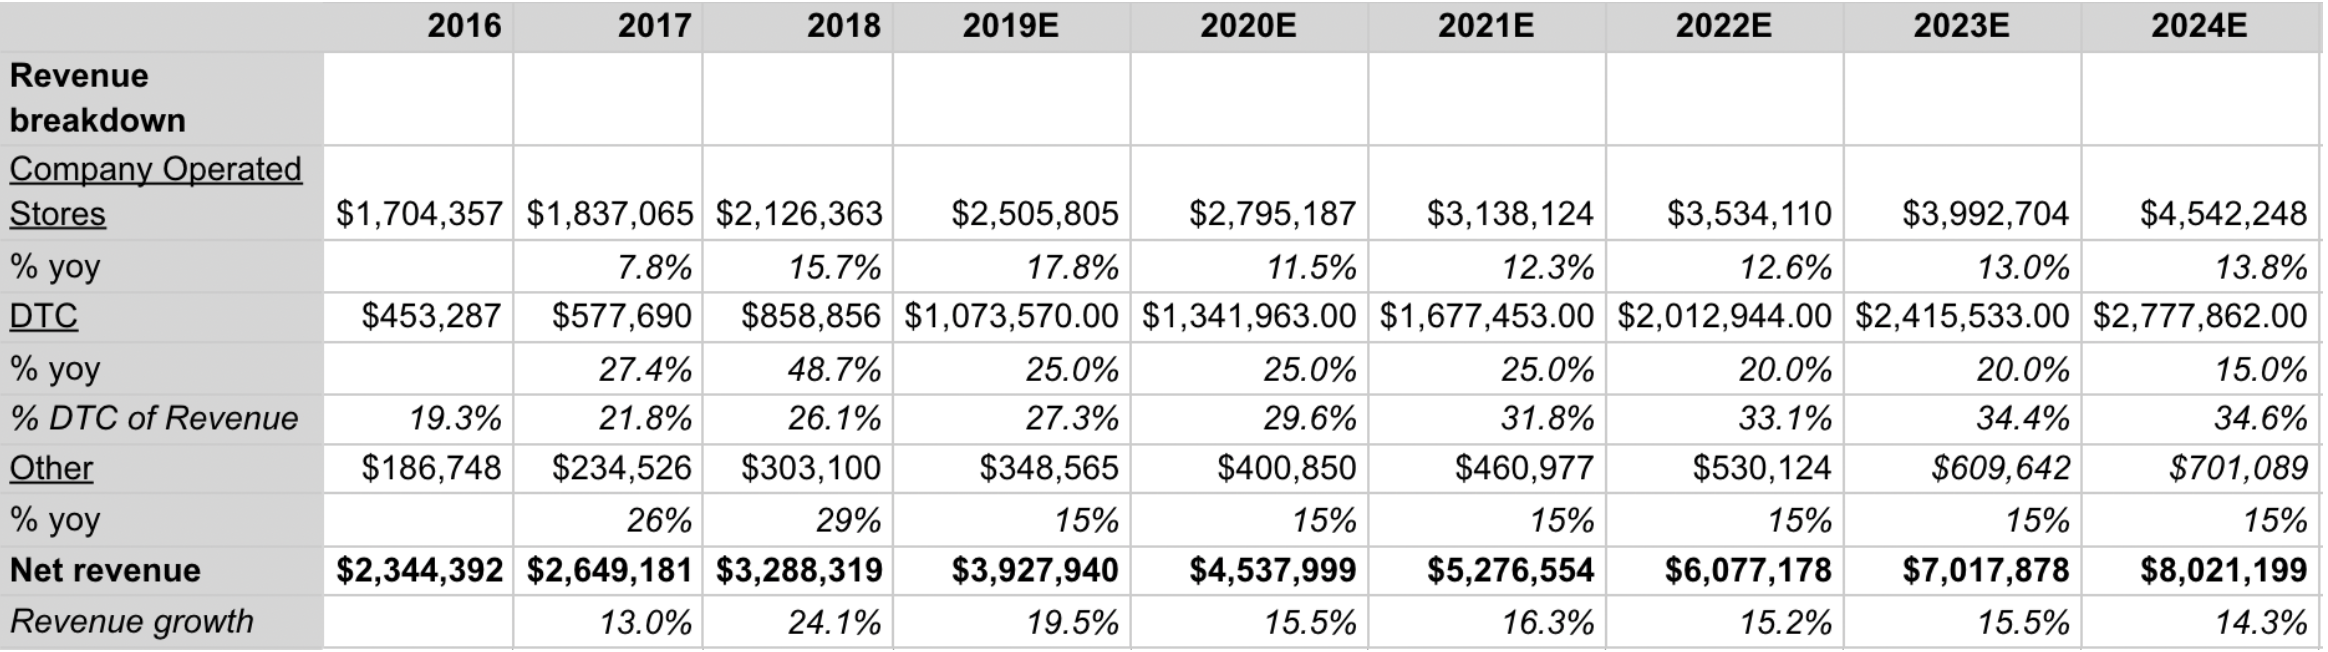
Lululemon has projected that direct-to-consumer (DTC) sales will at least double by 2024, a reasonable target given the company’s ability to drive online traffic in recent quarters. Online sales were up nearly 50% in the past year. In terms of profitability, online sales eliminate a plethora of costs between manufacturing and delivery to the consumer, hence allowing for margins of over 40%, compared to ~20% with in-store sales. These increased margins will help power overall company margins and offset costs in other areas. 

—

 In considering this three-pronged approach, it is apparent that Lululemon Athletica is exploring new avenues for revenue growth, having only just commenced its worldwide expansion. We assume a consistent revenue stream for each store opened until 2024 based on current figures. We also expect online sales to continue its growth in the double digits and subscription-based revenue growth of 15% per year (Other). Putting the above three revenue avenues together, we predict that Lululemon is poised for consistent revenue growth in the mid-teens through 2024. 

Just a Trend? On Brand Strength and Loyalty.

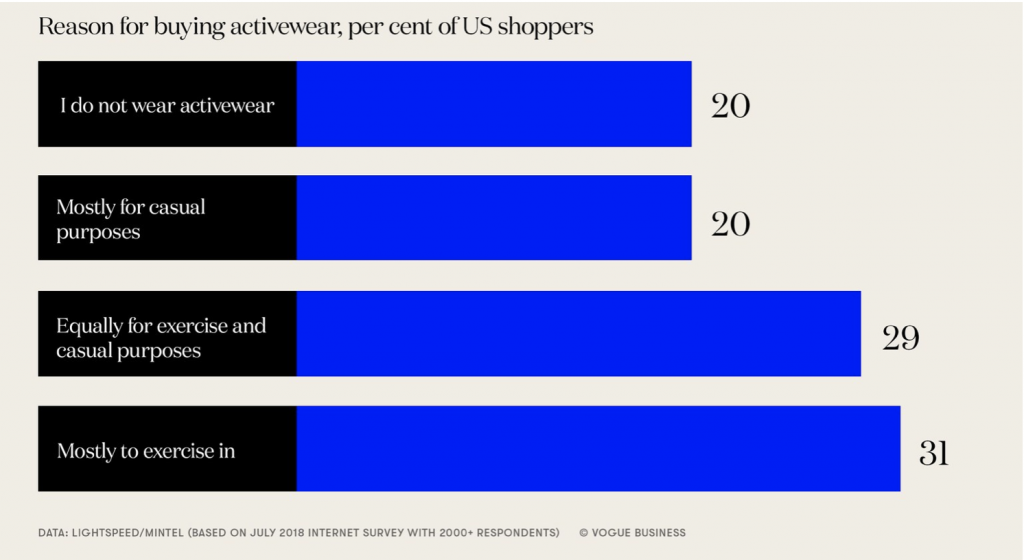
Lululemon’s projected success detailed above is contingent not only on the attraction of its products, but on the general success of the athleisure industry as a whole. There is a general push towards “wellness,” and buying goods that feed into this mindset. In fact, a growing percentage of Americans buy activewear not just for athletic activities, but as everyday wear.

Images from Lululemon’s experiential store in Chicago offering smoothies and yoga classes, reflective of the company’s push to integrate customers into a larger ecosystem.

Moreover, Lululemon has emerged from its position as a mere retailer. It is no longer a brick-and-mortar shop where purchasing athletic gear is the only appeal. First, the Lululemon brand is especially prominent and the name-value brings with it a host of advantages, a feature its customer base is most definitely aware of. The distinct reflective horseshoe logo has become a recognizable symbol of wellness and athleticism. As mentioned above, in addition to in-store and direct-to-consumer sales, a third portion of revenue comes from subscriptions. Lululemon has recently made a large push towards incorporating customers into a greater ecosystem, offering yoga classes and membership to running clubs. Its new paid loyalty program, similar to a program that current Lululemon CEO Calvin McDonald implemented during his tenure as CEO at Sephora, ensures customers return for limited-edition products, free expedited shipping, and other perks. As of Q3 2019, the program has had positive “results [that] have been well above our expectations going in very favorable,” according to McDonald. They have teamed up with SoulCycle to offer custom-made gear, solidifying its name in the high-end athletic space. 

From Lululemon’s website: a look into its differentiating technology

Lululemon also sets itself apart due to its technology. The company’s research and development lab within its headquarters, Whitespace, is made up of around 50 employees that include scientists and physiologists. Lululemon’s quality goods contribute to the company’s strong ability to retain customers while demanding a high price point.

Strong Financials

Lululemon has a great balance sheet, especially for a more than 20-year-old company, the main takeaway being that they have no long-term debt. With continued revenue growth and higher margins, we expect cash flow to sustain and reflect in shareholder’s equity.

Comps

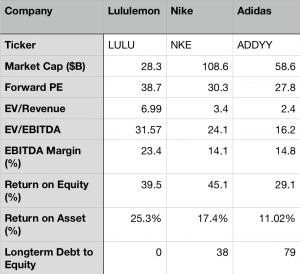
In comparison to its largest competitors, Nike and Adidas, Lululemon certainly seems to be the most overvalued. Despite its high EV/Revenue and EV/Revenue numbers, Lululemon’s small market cap in comparison to Nike and Adidas is indicative of its immense growth opportunities. Moreover, its return on asset figure is higher than competitors, an attractive quality for growth valued company.

Risks: A Discussion

I will address a few potential risks to Lululemon’s revenue growth.

Tory Burch’s luxury athletic wear store, Tory Sport, on Fifth Avenue

A main worry in the athleisure industry is the low barriers to entry and the resulting competition. Seeing Lululemon’s high margins, it is an attractive industry for outsiders. In recent years, Nike and Adidas have greatly expanded their women’s lines in an effort to compete with Lululemon. Many higher-end names such as Tory Burch alongside streetwear brands such as KITH have also waded into the athleisure space. However, as discussed earlier, Lululemon has and continues to integrate customers into a larger Lulu ecosystem, making Lululemon more than just a retailer. At the same time however, changing preferences and trends could potentially have large impacts on Lulu’s profitability. 

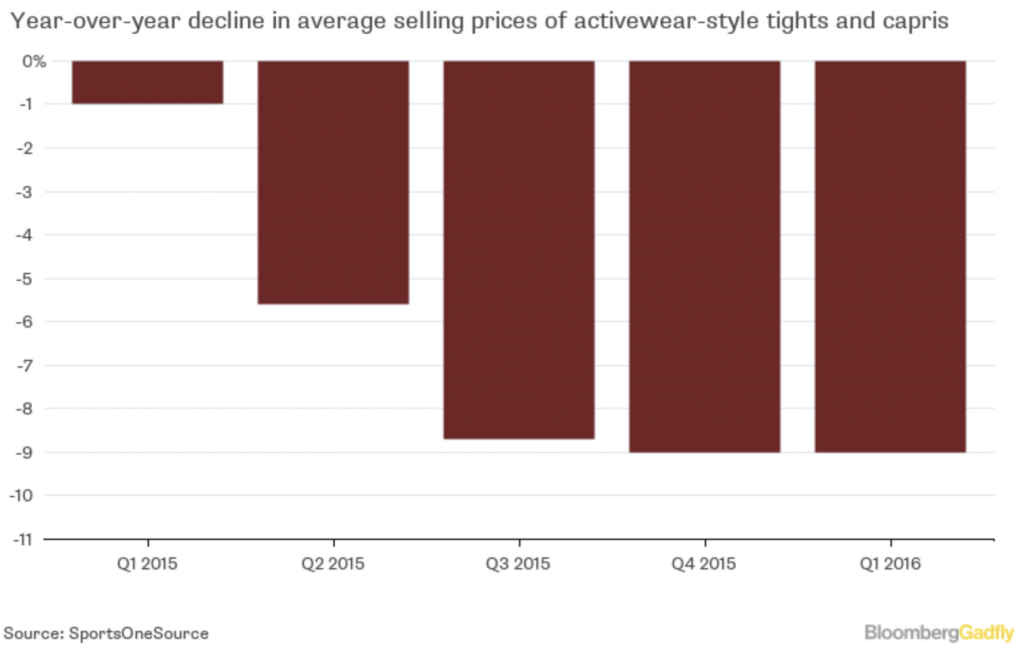
Another concern with low barriers to entry is the possibility of a drop in prices of similar goods. For the past few years, Lululemon has been able to sell nearly all of its inventory at no discount, due to a deliberate strategy to lower supply and entice customers. However, in recent quarters, the company’s sale section has been expanding, and many so-called “less-trendy” leggings go for as low as $60. Whether this new pricing strategy feeds Lululemon’s profitability is yet to be determined.

Given the current political climate, the possibility of U.S-China trade tensions affecting profitability is a valid concern. However, in its most recent quarterly report, Lululemon claims that only 6% off its total inventory would be affected by import tariffs; it has recently pushed to diversify its manufacturing bases, and most of which now occurs in Vietnam and Cambodia. 

Conclusion

Lululemon Athletica is a company with strong financials and an even stronger growth potential. By tapping into yet-to-be-explored markets, we expect to see Lululemon continue its emergence as a worldwide player. Its unique ability to innovate and dedication to creating quality products coupled with an overall shift towards comfortable clothing will allow Lulu to sustain its high customer retention rates. 

Auto Partner SA: Polish Auto Parts Apparently Boring, Yet Lucrative

By David Shakirov

The “hunt for value” in US equity markets is a tough one. High valuations and economic uncertainty are some of the barriers challenging investment managers in the United States, trimming alpha to zero (or, in some cases negative). Abroad, however, frontier and emerging economies offer higher growth potential at lower multiples. These opportunities are often overlooked for mostly irrational reasons, opening a whole field of study named the “Home Bias”. Since Williams Insight is in the business of offering our take on lucrative investments, this bias opens a window to do just that.

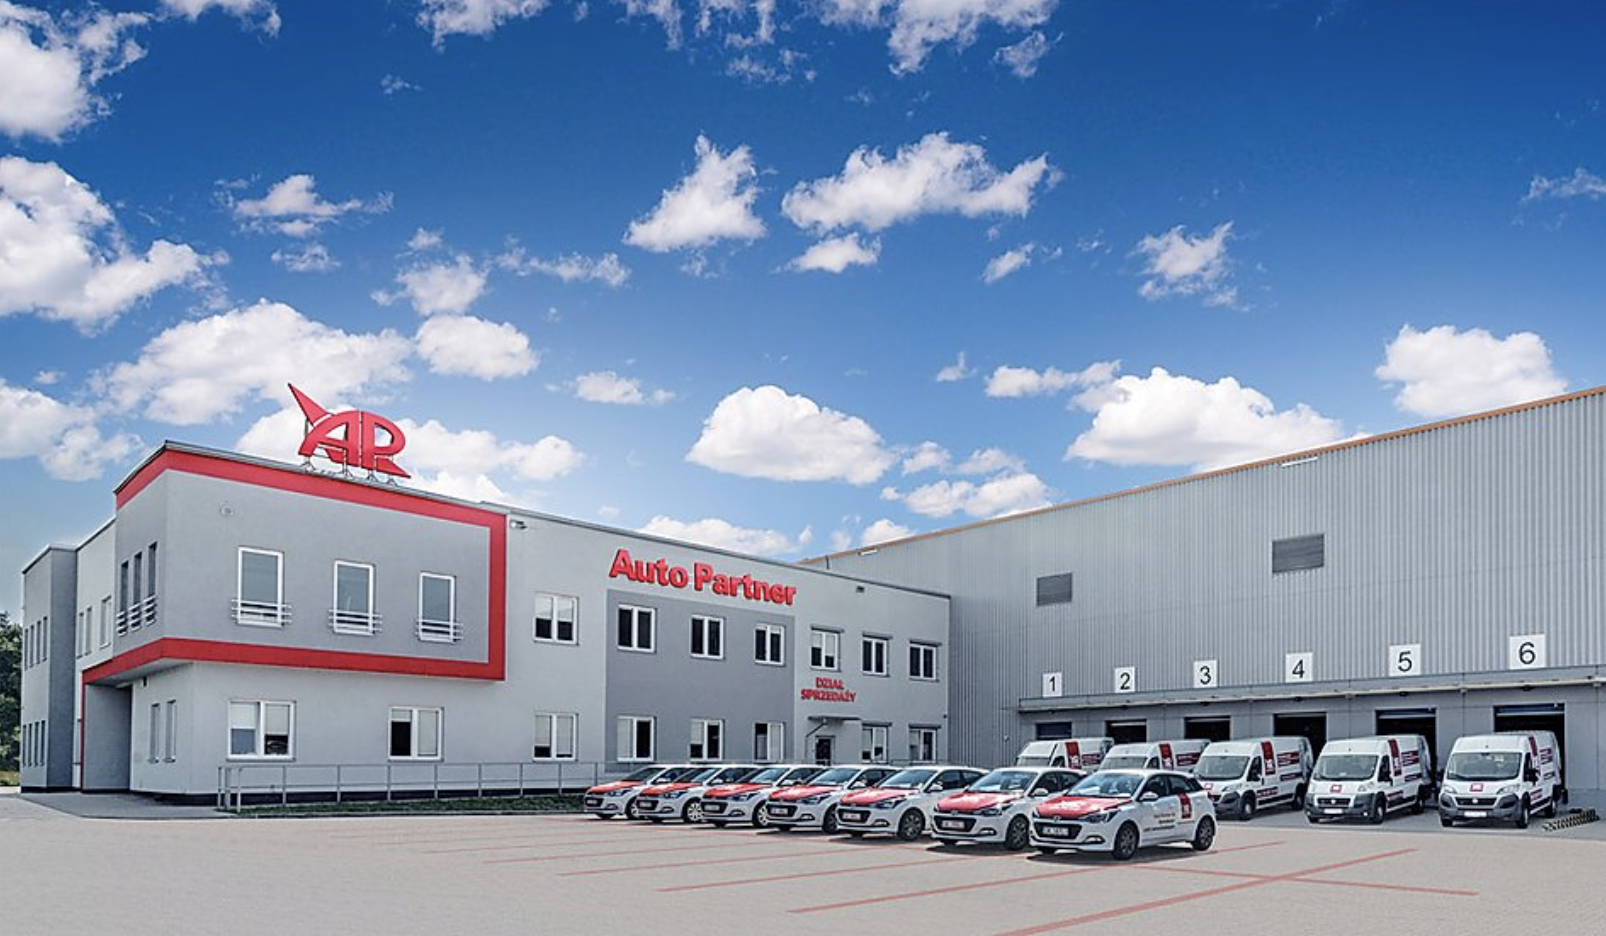
Here, I’ll cover “Auto Partner SA”, a Polish auto parts distributor that is a fast grower, trades at attractive valuations, and should reap considerable gains for investors even in conservative profitability outlooks. Founded in 1993, Auto Partner’s business focuses on selling auto parts for engines, transmissions, suspensions, lighting, etc. to mechanical shops around Europe, while taking advantage of an incredibly fragmented industry segment.

The Polish Backdrop 

 Auto Partner’s business is centered around Poland (its equity trades on the Warsaw Stock Exchange), although some of their operations are international in countries like Czechia, Austria, and Germany. The Polish economy, although relatively obscure to US retail investors, is one of the best localities for global investing. Poland, for instance, did not contract during the 2008 recession, and grew 5.1% in 2018. It has a population of 40m people, and is the largest economy in central/Eastern Europe. FTSE Russel had the conviction to upgrade it to “developed” last year (the first country to be upgraded in 10 years). From a regulatory standpoint, Poland is a stable nation — it is a member of the EU & NATO, and has an IFRS-compliant legal/financial system. Although it is relatively obscure for American investors, it does not have the political uncertainty that occupies most other fast-growing, off the beaten path economies. I challenge readers to identify any other with 5% GDP growth, attractive valuations, and a comprehensive legal/financial infrastructure.

Source: European Commission 

Auto Partner Business Model

The car parts business is not direct to consumer, but rather, entails distributing parts from manufacturers to auto shops. Auto Partner operates warehouses that allow it to ship parts from manufacturers to its customers (70% online, 29% in-store, 1% DTC), most of whom are mechanics.

Currently, the auto parts supplier market in Poland is incredibly fragmented — Auto Partner, one of the largest auto parts supply companies, has 7-8% market share. This gives Auto Partner an incredible advantage as it picks up “stranded” customers from auto parts suppliers that are smaller and go out of business. More speculatively, this fragmentation also provides M&A potential as private equity money is flowing into Poland at record levels.

Growth, Financials, and Valuation

Auto Partner’s business has been growing rapidly since its IPO in 2016. Here are a few highlights:

 +31% revenue (3 year compounded annual growth rate)

+43% EBITDA (3 year CAGR)

+53% Net Income (3 year CAGR)

Going forward, management guidance is targeting 20-25% top line growth and possibility for improving EBITDA margins.

Now, let’s model this out as a simply EV/EBITDA multiple to see how much equity upside there is…

 If we assume a conservative growth rate of 20% (2020), 20% (2021), and 15% (2022), and ignore the potential for improving EBITDA margin, we will observe the following EBITDA numbers…

Then, if we take the EBITDA numbers and apply 6x, 8x, and 10x multiples, after adjusting for net debt, we can arrive at the 2022 Equity Upside, as seen in the right-most column.

Although you can draw conclusions for yourselves, this model showcases that if Auto Partner can maintain the current 7% EBITDA margin, exhibits growth at or below management guidance (and significantly below the historical average), all while it’s EV/EBITDA multiple (which is currently 8x) compresses to 6x, there will still be 140% of equity upside in 2022 (which is 2.4x the initial investment, or 34% annual equity returns).

Recommendation: BUY at the current price of 4.33PLN

iPic: A Thriller

By David Shakirov

There was a time decades ago, when going to the movies was a spectacular affair. Forget cramped seats, with years-old popcorn stuck in-between its cheap, polyester cloth. Or the overpriced, low quality food offerings. Nowadays, the movie theatres themselves are normally wildly empty — industry insiders cite a capacity utilization rate in the teens %. No, this is not a piece on why, or how, Netflix became a $140B company. It is, however, a speculative tale of a theatre company trying to change an otherwise boring and slowly bleeding industry. What’s in its way? The Retirement System of Alabama, of course. That is, this article will try to explore the relationship between the RSA, a $44B pension fund, and iPic, a luxury dine-in movie theatre concept that found the wrong partner in its capital intensive crusade for selling movie-goers reclining chairs, martinis and lobster rolls.

In a 2015 interview, AMC’s CFO Craig Ramsey acknowledged that the industry is slowly suffering. He noted how movie theatres, unlike most other businesses, only operate at an 11% capacity, and how, by expanding and improving its seat offerings (and increasing the ticket prices), the number of attendees grew by close to 50%. It was years before Ramsey’s realization that Hamid Hashemi was slowly developing the luxury dine-in theatre concept. Out of this came “iPic”: a concept that rapidly decreased seats per square foot, expanded the size and comfort of each seat, increased the price 2-3x, and sold restaurant quality food and booze during the film screening. The business grew, opening locations across the nation in high end neighborhoods, throwing expensive, celebrity filled launch parties, and inviting “mixologists” and chefs to populate the kitchens. While AMC struggled with $460k of annual revenues per screen, iPic enjoyed $1.65m of per screen on its most luxurious offering

At a glance, iPic seems like a ripe growth story. Inorganically, iPic wants to grow via expansion. They operate 14 theatres, with plans for 43 by 2025, and over 250 in the long run. They also want to capture 13% of the Saudi movie market after acquiring rights to open there. Each opening is financed through a long term lease, with total debt reaching average levels of $11m/theatre. In year three, iPic sees roughly 25% unlevered free cash flow returns on a new theatre, enough to pay back debtholders, and hopefully, with scale, cover its cost of goods and corporate overhead.

Organic growth is major, as well. This year, iPic plans to revamp its movie theatres to include almost 100% high end seats (think not “premium” but “premium plus”). Why? Because it found that customers prefer the more expensive offerings 4:1 to the cheaper ones. iPic gets 60% higher ticket revenues from its already high-priced tickets, and patrons spend 80% more, on average, on food and booze (win-win). Also, it’s expanding the revenue stream to include other sources, including high end advertising revenues (given its target demographic), alternative theatre revenues (renting out theatres for gaming events, for instance), etc. Overall, it’s revenue per guest is up 25% since the beginning of 2015. Even with disruptions in its theatres (during renovations) and a slow movie market in general, iPic has seen a high teen revenue growth CAGR and a 10-12% store level EBITDA margin.

Actually, its store level numbers and gross margins looked pretty good. Its unlevered returns were not bad either (again, coming in at 25%). These were the statistics that management, on its investor presentations that have since been taken down, emphasized. What these numbers fail to highlight though, is the massive debt load of the company, and its toxic corporate overhead. These two have drawn the company deep into the red, at around -25% of revenues, bottom line. As iPic’s revenues swelled from $98m in 2015 to nearly $150m in 2018, its corporate overhead doubled, along with its “other expenses” (a line item for maintenance and miscellaneous costs). These two line items alone have continuously drawn the company into the negative, excluding the interest payments (15% of revenues) on its debt.

Maybe it’s the CEO/Founder/President/Chairman’s (all the same person) $5m pay package (with cash compensation actually increasing from 2017 to 2018 as the business bled harder and harder), or the company secretary’s $3.7 comp + equity. In total for 2018, the company cites $9.4m in relation to equity-based comp. I’m not attacking a system that incentivizes executives to perform through equity-pay, but raising the point given how much overhead the company sees (why not cut the pay in half, and given the company’s proposed and believable rapid growth, have the execs put their own cash into the stock? With the stock down 90% in one year, the equity-based incentive to operate the company efficiently did not work as planned…)

In the meanwhile, the Retirement System of Alabama (RSA) promised to fund this growing, capital intensive business. I bet they heard the same-store EBITDA and unlevered FCF pitch and drank the fruit punch. I know I did. Anyways, since 2010, the RSA has funded hundreds of millions of dollars worth of CapEx, store openings, and negative EBITs, while at the same time owning class B pre-IPO equity in the company. This has now converted into a 40% equity stake, in addition to owning all of iPic’s senior debt. Yep, the Retirement System of Alabama is practically fully in charge of a luxury dine in movie theatre concept.

The RSA, just like most investors, has likely had enough. In July of this year, the RSA has declined to allow iPic to draw $10m from its $190m credit line. Why did it need the $10m? To make an interest payment on its massive debt load to … none other than the RSA. The intention is clear. In their pre-IPO filing, iPic outlines its credit agreement with the RSA as follows:

“The remaining availability under the RSA Facility requires us to achieve certain operating targets before we may borrow.” (SEC/iPic)

Last week, iPic announced its Chapter 11 bankruptcy, likely after its operating targets were not achieved and the RSA declined to extend credit. Or, as they say in Alabama, iPic “just got too big for its britches”. After the filing, the RSA lent iPic a $16m debtor in possession loan to maintain daily operations.

The business itself seems to be growing and is profitable from a gross margin standpoint. If the RSA or management can find a way to pump the brakes on corporate overhead, there could be significant operating leverage within the firm, especially as it pushes to expand from 16 to 250 theatres.

I’ve been an iPic movie and restaurant goer myself since 2016 and the business’ value prop is crystal clear. If the company emerges from restructuring, whether or not it is owned by great state of Alabama, continues with its expansion strategy, and takes massive action to cut down its overhead, it will be an investment in my portfolio. Until then, I’ll grab my popcorn and watch from the sidelines (or one of iPic’s patent pending “pod” seats) as the drama unfolds…

—

Source for Mr. Ramsey’s interview from AMC:

https://celluloidjunkie.com/2015/01/14/daily-cinema-digest-wednesday-14-january-2015/

Other sources: SEC filings and company presentations

Fiat Chrysler — From Rags to Riches [Sold]

By David Shakirov

UPDATE 11/4/2019: As of 11/4/2019, the author recommends to sell FCAU.

Even after a capital gain of 17%, from $13.78 (5/28/19 closing price) to $16.14, today, the stock continues to trade at a compressed EBITDA multiple. Unlike its competitors, FCAU runs net cash, and will likely see margin expansion as it offers higher end vehicles like the Alfa Romeo CUV, electric Maserati, and a new three row luxury Jeep. This quarter, FCAU was able to increase adj. EBIT, even as revenues and volumes shrunk (which is even more impressive with a ~15% gross margin business).

However, two issues make the investment questionable. First, holding an auto maker late cycle can prove to be dangerous. Second, the merger between FCAU and Peugeot is a source of significant uncertainty. It becomes increasingly difficult to evaluate the synergies between the two auto makers, and the benefits of such a transaction. A sell will book a 17% gain for our readers (or 7% above the S&P 500).

\\\——————————————————————————————————————————///

In the late 2000’s the American car market was in shambles. Companies including Chrysler and General Motors were pushed into bankruptcy and provided a lifeline by the federal government. Coming out of bankruptcy in 2009, Chrysler was a financially distressed corporation trying to manufacture $20,000 vehicles during the worst financial crisis since the Great Depression — what I call a hard sell. In the meanwhile, Fiat, a small Italian car marker saw an opportunity. Sergio Marchionne, the CEO of Fiat at the time (and known to be a espresso-holic and chain smoker), began expanding his stake — 20% in 2009, to 53% in 2011, and a 100% acquisition in 2014. The result  — Fiat Chrysler Automobiles N.V. (FCA).

Following the merger, FCA’s vehicle portfolio turned to be incredibly diverse and highly valuable. It included brands like Ferrari, Maserati, and Alfa Romeo (the Italian three musketeers), Chrysler (built Detroit-tough), Jeep (the legendary off-roader), and Dodge (true American muscle). FCA continues to make vehicles from minivans to Italian sports cars. Since then, its brands have seen immense growth (Maserati volumes increased 8x, its Ram trucks saw 8 years of consecutive growth, Alfa Romeo sales up by 2.6x, Jeep sales doubled, etc). Only 10 years ago, the company was in financial ruin and faced near-death.

Its 2022 master plan was unveiled last summer (one month before its CEO, Sergio, passed away) at a sentimental event celebrating the FCA success story. Its goals (and my subsequent take) include :

  • $10B investment in electric tech

    • FCA recently spent over $2B to buy emissions “credits” from Tesla to meet strict carbon-laws FOR 2020 — electrification tech is important to keep emissions low

  • Partnership with Google’s Waymo and BMW’s Aptiv for autonomous driving

    • Unlike other companies, this partnership is less capital intensive. With Waymo, FCA will provide ~60,000 Chrysler minivans for testing, while it shares resources, data, and testing with BMW

  • Maserati volumes double to 100,000 (double from 2018) and margins increase to 15% (13.8% in 2018)

    • Maserati is moving to compete with the German’s high end offerings, while its current demographic is both 5-10 years younger and has a 2x average income (there is both potential to tap into the high-mid income bracket, plus offer higher end options, all to longer-lasting customers than the competition)

  • Ram is increasing its high end truck offerings to increase its ASP

    • The brand is seeking double digit YoY volume growth and lags by $5-10k behind competitors in ASP ($50,000 vs. $56,000 for Ford, for example). Given strong loyalty data, new high end offerings should increase revenues significantly. There is also untapped potential in the Asian markets with the Ram brand

  • Expansion of Jeep as a mainstream SUV brand, with a focus on electrification

    • Historically, Jeep had an image of a tough, military off roader. Now, it sells 1 in every 17 SUVs, while it expanded production capacity by 2.4x over the last four years. With SUVs constituting most car purchases in the US, it’s natural to expand into this market. By 2022, Jeep sees industry-wide utility sales (UVs) move from 32M to 37M, and has a long term goal of 20% UV market share. It will also introduce 4 dedicated electric UV models.

  • 1.75x EBIT growth, margin increase from 6.8% to 10%, cash increase from $12B to $20B

    • Growth prospects both geographically and within each FCA brand, platform and fixed cost sharing, and its increasing net cash position should improve the company’s already positive financial situation. This may result in dividend increases (current dividend yield is 4-5%).

FCA is a growth story in an otherwise lackluster, high-fixed cost industry. It currently trades at a 7x P/E (17x industry average) and is faced with little debt (0.15 debt/assets). FCAU even trades on a 0.15 PEG. In the case of a recession, the company is well positioned financially, and in terms of product offerings, to weather the tough environment. Aside from its net cash position, it also only put up 10% of its PP&E as debt collateral, and has access to a $7B credit facility (historically stable liquidity at $20B, or 2x annual SG&A + R&D). Given the economic expansion continues, however, the company has incredible growth potential — it will continue to develop its diversified product offerings and push its untapped geographical penetration in China and LatAm, for example. Its 4.5% dividends can also provide a cushion in the case of minor capital losses.

During the development of this article, I was given an opportunity to drive Alfa Romeo’s flagship sedan, the Giulia (first image) — a four door Italian rebuff of the German status quo. Why the Ramsey Alfa Romeo dealer trusted me with a $50,000 stallion is beyond the point — the vehicle drove on rails, a crystal clear step above your neighbor’s vanilla Benz. As I carved through North Jersey’s twisting and turning roads, I realized the Alfa (mind you, this is the “regular” Giulia, not the $80,000 sports version) went through near-hairpin turns at 40mph. If my anecdote is any reflection of the future, then FCA’s looks bright.

Regardless, who doesn’t want a vehicle built Detroit-tough, but with a hint of Italian love?

Recommendation: BUY at the current price of $13.78 (see updated at article header)

Revisiting Our 2019 Outlook

By Jack Brady

It’s been a pretty eventful 6 weeks since we published our initial outlook on 2019. Trade tensions have continued to ebb and flow, and the U.S. government shutdown ended uneventfully. The Fed has continued its “wait and see” approach to rate hikes, and as of Wednesday afternoon it looks like Powell may end the Fed’s balance sheet normalization at the end of 2019.

Since our 2019 outlook was always meant to be dynamic, we’re going to be revisiting a few of our “base case” assumptions about the global economy and the likely path of Fed policy that we posted back in January.

As a reminder, our three base case assumptions for 2019 were as follows:

1) Massive contraction in global liquidity.

 2) We’re late cycle.

 3) Powell is no Volcker.

 The assumption we’ll be revisiting in this post is the first, in which we assumed a steady balance sheet runoff on the part of the Fed, and no substantial easing on the part of global central banks. We’ll also be revisiting the likely impact of the Fed’s balance sheet runoff.

Our Updated View On Global Monetary Policy:

While we still don’t expect any substantial easing out of the major global central banks (we’re talking ECB and BoJ here — cuts from smaller banks such as the RBI aren’t particularly significant in our view), we are moderating our view on expected global tightening. After yesterday’s Fed minutes indicated that Powell intends to end balance sheet normalization this year, we see little reason to expect substantial tightening out of the Fed any time soon.  Just three months ago, Powell claimed that bond maturities were “on autopilot,” so this drastic capitulation on his tightening plans indicates to us that the Fed is likely going to be on hold for a while.

Remaining Balance Sheet Normalization Poses a Mere 1% Headwind to U.S. Equities: 

 We have also updated our views on the likely impact of the Fed’s balance sheet runoff this year. Initially, we had said that balance sheet normalization would be a major headwind to global markets in 2019, but we no longer believe that is the case.

According to the New York Fed, an additional $312.6 billion of Treasuries will roll off the Fed’s balance sheet by the end of 2019; so will an additional $5.5 billion of Fixed Rate Notes and an $600 million of Agency debt and TIPS. This brings total expected tightening for 2019, and for the foreseeable future, to $318 billion.

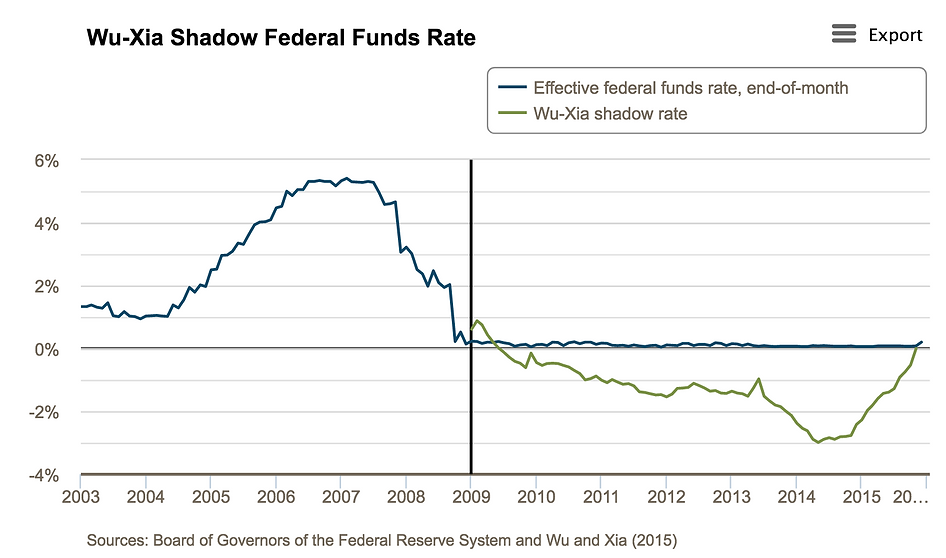
Using the so-called “shadow Federal Funds Rate” model developed by Wu & Xia at the Atlanta Fed, we have attempted to back out a reasonable value to assign to quantitative tightening, in terms of equivalent Federal Funds Rate hikes.

If we assume this model is correct, then the peak of the Fed’s $3.5 trillion Quantitative Easing program that ran from 2009 to late 2014 corresponded with a “shadow rate” of -3% (see below). With the Fed Funds rate pinned at zero that entire time, one can assume that $3.5 trillion of quantitative easing equated to roughly 12 rate cuts, so about $290 billion dollars of quantitative easing is needed to replicate the effect of one rate hike. Ignoring the fact that quantitative easing likely experiences diminishing marginal returns, we estimate that $290 billion of quantitative easing equates to approximately one rate cut, and vice versa.

Note that the so-called “Shadow Rate” bottomed out at -3% in late 2014, coinciding with the peak of the Fed’s QE program. Source: Federal Reserve Bank of Atlanta

Note the Fed’s balance sheet peaked at roughly $4.4 Trillion in late 2014, rising from just under $900 billion pre-crisis on account of their ~$3.5 trillion QE campaign. Source: Board of Governors of the Federal Reserve System

Based on this simple estimate, the threat of the Fed’s balance sheet reduction is much smaller in size than we initially thought. The $318 billion of quantitative tightening that is scheduled for the rest of 2019 should equate to barely more than one rate hike.

Turning back to the path of risk assets, we can use the seminal 2004 paper by Kenneth Kuttner and Ben Bernanke to determine the likely impact of this quantitative tightening on the S&P500. Their paper, which analyzes the reaction function of the stock market to Federal Reserve policy changes, indicates that a 1/4 point cut in the Fed Funds rate generally correlates with a 1% rise in the S&P500. By this logic, the $312 billion in bonds rolling off of the Fed’s balance sheet over the next 10 months represent a headwind of little more than 1% to U.S. equity benchmarks.

The bottom line is that our fears regarding a “massive liquidity contraction” were likely overblown. However, our contention that the Fed is done with rate hikes for now and that the economy is very late-cycle remains in tact, as we have seen little evidence to the contrary over the past month and a half. Our moderated expectations regarding balance sheet normalization merely mean that this rally may have a bit more room to run than we originally thought.

How Does This Change Our View? 

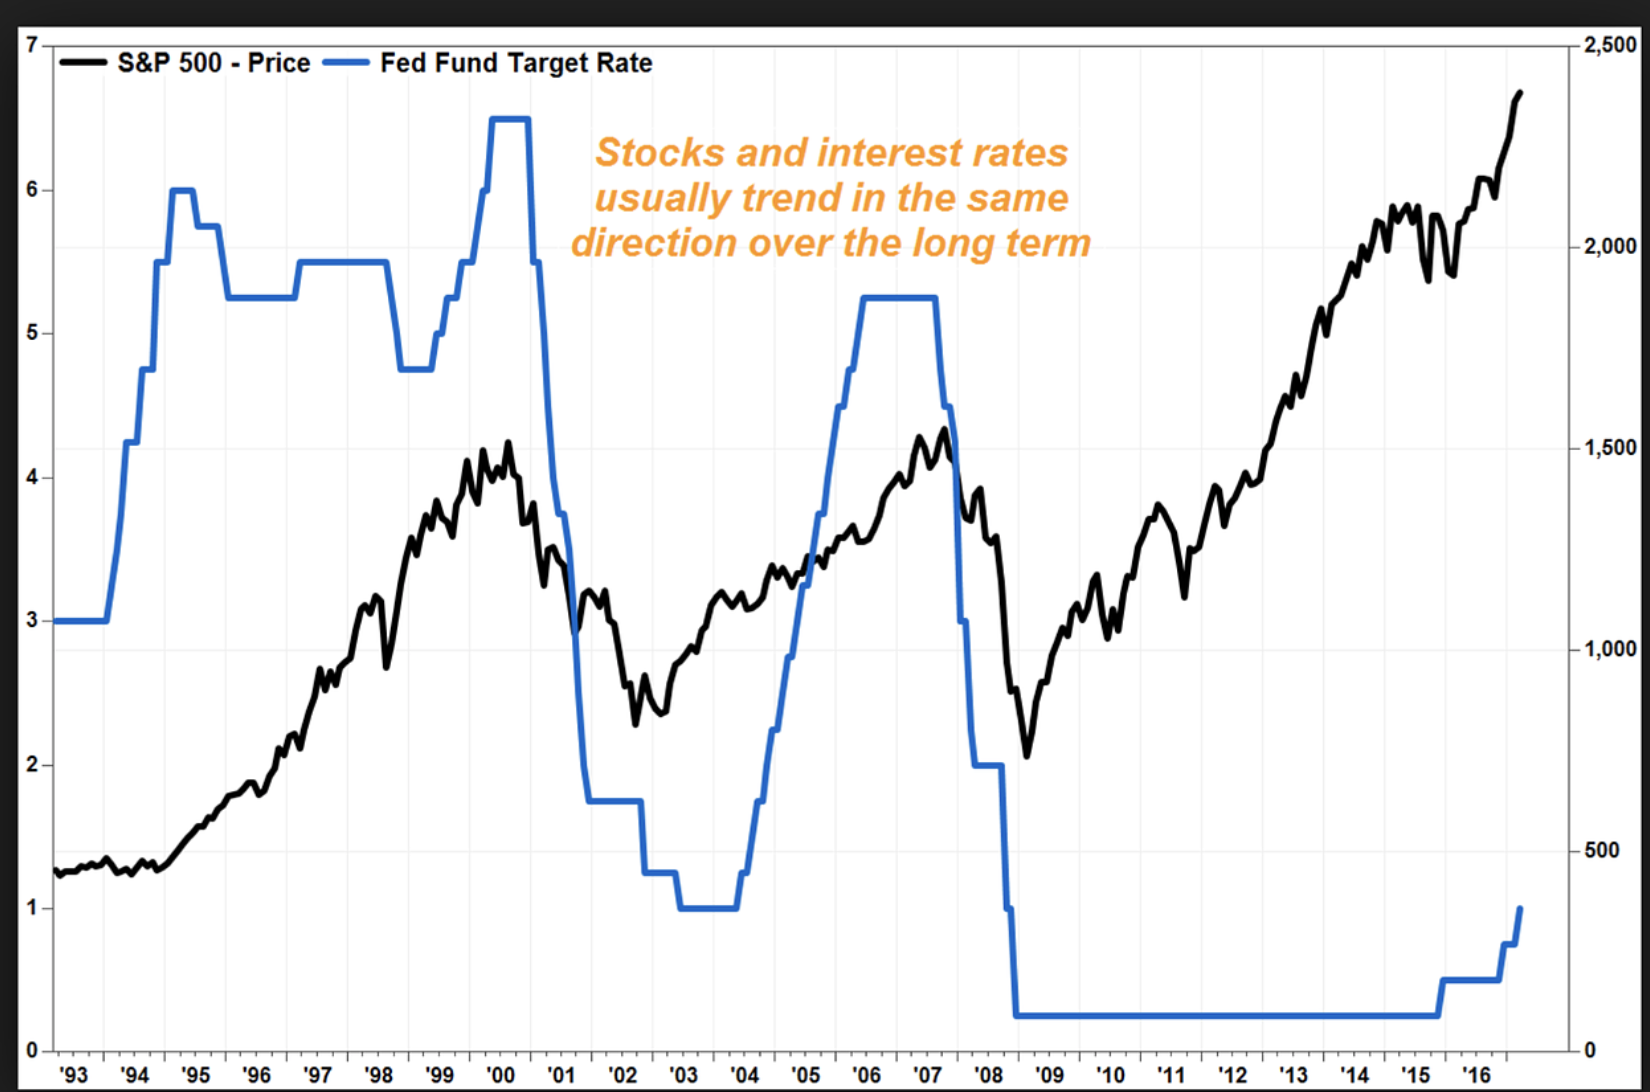
At the end of the day, recent developments have only strengthened our conviction that it’s time to sell this rally, or at least to dial back equity exposure significantly. The Fed’s capitulation on rate hikes and balance sheet normalization, along with broadly soft global economic data, indicates to us that the Fed is done hiking for this cycle because they think they have finally broken something. We expect the mechanical rally in stocks to continue as interest rate expectations are revised downward, followed within a few months by a recession and substantial drawdown in global equities.

We’ll conclude with a chart that we pulled from our Macro piece published in December (please ignore the commentary on this graph for the purposes of this discussion). What this chart shows is that there is typically a knee-jerk rally in the stock market after the Fed ends a tightening regime, but that the weak economic fundamentals that cause the Fed to do so eventually win out after a few months. In our minds, this market remains a rally that you want to sell, in spite of weaker-than-anticipated headwinds from quantitative tightening.

Ferrari — How Much is a Prancing Horse Really Worth? [Sold]

By David Shakirov

UPDATE (6/13/19): the author recommends selling Ferrari stock. Currently, shares trade near $160. Given Ferrari’s guidance for 2022, the stock is trading at a 30x P/E on those numbers, or a 50x+ P/E on today’s figures.  Macroeconomic headwinds may still push down its equity price in the next 12-18mo, though Ferrari NV’s underlying business will likely not be impacted as severely as most corporations.

Insight readers will book considerable capital gains: since the article’s publishing just 5 months prior, Ferrari stock has climbed 40%, or 31.2% above the S&P 500. 

\\\—————————————————————————————————///

In my last article, I spoke about Ford — an international behemoth with revenues of $150B+, low margins, distressed investor sentiment, and production numbers of over 6 million cars per year. Ferrari is also a car company, is publicly traded on the NYSE, and starts with the letter “F”. That’s where the similarities end.

Here’s why Ferrari is so interesting — unlike traditional car companies, Ferrari has immense control over its top line and customers. More specifically, Ferrari admits to limiting production of its vehicles significantly below demand to enforce an aura of exclusivity, luxury, and brand image. The latter, Ferrari admits, is crucial to its business. However, how can a publicly traded company answer to Wall Street’s insatiable appetite for GROWTH? Ferrari’s medium-term solution is to grow its product lines (sports cars, GTs, and Purosangue, or SUV) and expand its demand base significantly, while growing supply at a meager 7-8% per year. In this way, Ferrari essentially controls their top line in the short run. The longer run issue, however, is when will its production finally reach demand, forcing the company to lower prices or lose its brand image? Ferrari’s current

valuation has limited medium term upside (more on this later), but investors may be interested in three factors — high dividend potential (when the company matures in the mid-late 2020s), international growth (in EMs, China, and LatAm), and nearly universal brand value and name recognition.

The relationship between Ferrari and its customers is highly unique. Of its car sales, 65% are to existing Ferrari owners while around 30% are to owners with at least 2 Ferraris. To be “allowed” to buy one, prospective clients are often screened by their devotion to the brand through Ferrari fan-clubs, general passion for the vehicles, financial standing, and other unknown factors. Owning a used Ferrari also helps. Then, customers ate pushed to buy the entry-level variants (such as the California or Portofino). This, combined with its undersupply strategy, could position the company to weather a recession incredibly well— they control who buys the cars, and tons of clients want them! In 2008, when Ferrari was not as prominent in LatAm, EM, China, etc. and did not offer as wide of a lineup, its auto sales slumped 10% (while the luxury performance auto market shrunk in half).

It is possible that in a mild recession, Ferrari’s production may continue to rise as even recessionary demand for its prancing horse declines, given the significant gap between supply and demand.

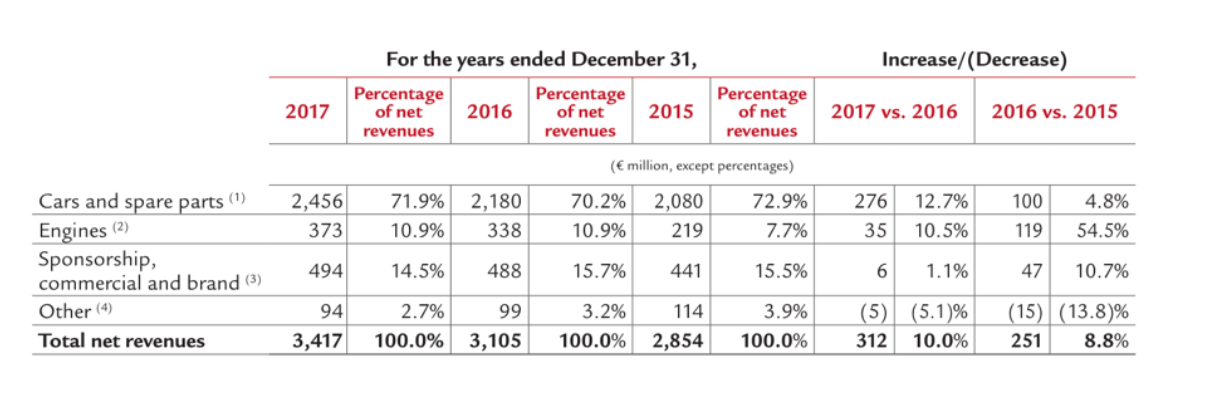
Although Ferrari is known for its car production business, this only accounts for 72% of revenues. Another 11% is engine production for Maserati (which accounts for ~80% of Ferrari’s total engine production, with the rest for Ferrari vehicles). Another 15% percent is purely based on its brand — licensing and distribution fees from selling Ferrari merchandise (think hats, shirts, and Legos), Ferrari World Abu Dhabi, and other brand-related revenues. Capital-wise, Ferrari took advantage of low rates (bonds with 25bp coupons) and secured a number of large bond offerings (it has 1.8B Euros of debt on the balance sheet, and runs net debt). Given its high margins, ability to refinance, and strong top/bottom line growth, the debt likely does not pose a significant risk to the business.

There are other important risks, however. First, international emissions regulations are pushing Ferrari into two directions. The brand could either keep buying emissions credits (by paying “clean” companies like Tesla, given Ferrari’s twelve-cylinder gas-guzzling sports cars) or begin improving efficiency. The latter strategy, which is realistic into the future, would involve hybrid motors and electrification (both of which Ferrari is trying to avoid as to not damage its brand reputation for gas-motor sports cars). Ferrari promises that in the next 3-4 years, 60% of its lineup will encompass hybrid tech and that these models will stay true to their Italian high-performance roots. Competitive risks also exist, from brands like Lamborghini, Aston Martin, Bentley, and Rolls Royce. Most of the competition is also backed by larger auto companies (Volkswagen Group in the case of Bentley and Lamborghini, BMW for Rolls Royce, etc.), which Ferrari had until its spin off and IPO in 2014. The benefits of this include better bargaining power, platform sharing, lower costs, etc. (for example, the new Lambo SUV is on the same platform as Audi’s Q7, also owned by Volkswagen). Additionally, given that 77% of Ferrari’s sales are of its lower-end V8-engine cars (which have an MSRP of $200-300,000), competition at these price points is higher. This may further discount the value of the Ferrari brand, as clients may be inclined to purchase competitive vehicles (either for lower-price or better quality). As Ferrari increases its production numbers beyond competitors due to its publicly-traded nature, it may also lose its exclusivity and touch with customers (this may not be an issue, however, if the company expands into different categories like hybrids and SUVs).

Through a DCF, I considered three cases — a base case ($116 target) where company guidance through 2022 is generally met (see the “Key Financial Targets” table), a bear case ($97 target) which includes a recession, and a bull case ($127 target) where company guidance is generally met two years early. The base case assumes a 4.7% annual growth rate of the core vehicle business (based on the CARG of the last 5 years), a 10% annual increase in Maserati’s engine demand (based on Maserati’s growth goals), and a 3% annual increase in the sponsorship arm (conservative growth). The bull case assumes the same 4.7% growth rate (since a “bull” scenario does not mean more production, given Ferrari’s exclusivity model) of the core business, but a stronger 20% y/y growth of the Maserati engine business, and slightly higher growth for the sponsorship business (somewhat conservative 5% per annum). Finally, the bear case assumes zero growth for the core business (not a decline, however, since Ferrari’s market is quite undersupplied), a 25% decline in Maserati’s business (based on luxury auto market behavior in 2008 from competitors like Mercedes/BMW), and a 20% decline in sponsorship (given a 15% decline in retail sales in 2008).

As you can see for yourself, there is not much upside or downside in the stock. However, given that they directly control around 70% of their top line results by controlling supply, the company’s performance has little downside in a recession. The short to medium term upside, however, is weak as well. Maybe I should have written this article two years ago, when Ferrari was trading at $40 (and not $110!) and had similar fundamentals. If you already own the stock (and don’t want to realize your gains for tax purposes), or are looking to invest longer term, there are a number of reasons to stay in. First, the company promises to buy back ~10% of its market cap over the next 2-3 years, has long term growth opportunities in markets like LatAm, China (where they sold only 617 cars in 2017), and other EMs, especially if it will expand its line-up to include hybrids and SUV-like vehicles. Its incredible brand value doesn’t hurt as well, while the prospect of a cash-cow business opens up the opportunity for high dividends (which are strongly considered by management for before 2022).

Overall, Ferrari is an exciting company. Unlike most car companies, it has immense control over its customers and makes exciting products. I live only a couple miles away from Ferrari’s North American headquarters and had a chance to chat with some of their engineers. One told me that Ferrari’s engineering and designing prowess (in terms of features and reliability) has improved drastically from just 3-4 years prior. Surprisingly, only two years ago, most car journalists weren’t excited about Ferrari’s vehicles and presumed that the company was relying too much on their brand to sell their cars. As a car enthusiast, I checked out the new Portofino, 812 Superfast, and some of their future offerings — Ferrari has massively stepped up products. The auto world agrees.

And who knows, maybe by buying Ferrari stock for growth you’ll be able to purchase one of their heart-stopping, pants-dropping cars down the road. If they’ll let you, that is.

General Motors 2: Electric Boogaloo

By Michael Medvedev

NYSE – GM

Price: $35.53 (Date of price: 1/9/2019)

Price Target: $45.00

P/E Ratio: 58.25

EPS: 0.61

52-week Range: $30.56 – $45.52

Market Capitalization: $49.653 billion

Shares Outstanding: 1.411 billion


Overall Markets and Auto Industry

Since 2017 there has been a dramatic transition in market conditions from long-running market stability to a drastic increase in volatility and price fluctuations as a result of trade wars, rising interest rates, and concerns around slowing economic growth. In a market with greater and more frequent losses––caused by the increase in volatility––it might be an intelligent decision to add a low beta or stable dividend stock in order to lower volatility and stabilize one’s portfolio. Since vehicle sales peaked in 2016 (Figure below), the auto industry has been a market to avoid for several reasons: investment banks downgraded the sector ratings; industry dynamics changed due to the rise of car-sharing services (Uber and Lyft); millenials are buying cars at a slower rate than previous generations. However, GM’s recent activity shows otherwise and indicates its futuristic outlook as a company prepared to thrive and spearhead the future of vehicles (namely, with electric vehicles).


 Company Overview

General Motors Company, or General Motors (GM), is an American multinational corporation which designs, manufactures, markets, and distributes vehicles (6 brands) and vehicle parts. It is the largest automobile manufacturer in the United States and one of the largests car manufacturers in the world. GM manufactures vehicles in 37 countries and has investments in multiple foreign brands.

History of General Motors

Along with most companies, the 2008 recession left GM with $31 billion in the red, making them unable to pay their suppliers and meet loan obligations or cover health care costs of its workers. However, with the Obama administration’s assistance, GM successfully survived failure by spinning out assets (creating more cash flow) and being granted billions in taxpayer funds. Soon after, they announced a government-backed Chapter-11 bankruptcy, restructured their leadership, killed off unprofitable brands, and focused more on producing fuel-efficient vehicles. With over $50 billion in government assistance – and all but around $10 billion repaid – it is safe to say that the government had a major impact on the turnaround of the auto industry. Following the recession, a successful IPO, and a steady increase in vehicle sales and net revenue fueled the company and got it back up and running… on all four wheels.

Recent Developments:

As of November 26, 2018, GM announced their plans for restructuring their business, outlining their vision for the future. Their plan includes eliminating up to 14,700 jobs (8.2% of all GM’s employees) and idling production in 5 plants. 57% of those job eliminated are in the US.  In addition GM plans to cut salaried staff by 15%, 8,100 employees and end production of several passenger cars including the Chevrolet Cruze, Volt, and Impala, the Buick LaCrosse, and the Cadillac CT6.

Why? / Catalysts

1. Preempting a possible Recession

Auto sales depend on consumer confidence, which in turn is correlated to economic cycles and markets. In a good year, light vehicle (Cars, SUVs, and Pickups) sales are expected to reach 17 million vehicles, while during a recession, sales drop to 12 million. The cycle exists because after a certain number of years, individuals need to buy a new car. An individuals income induces one to hold on to their car a little longer as opposed to re-entering the automobile market. Therefore, if income declines in all income categories, less individuals will enter the market leading to less sales. These drops in sales have a big impact on GM’s profit margins due to high fixed costs – labor contracts, factories, and imports of material. With the planned restructuring, GM benefits by lowering its break-even point (amount of units sold to break even) which would keep it profitable during a possible recession. With a prolonged expansion period and a nearing inverted yield curve, a predictable and inevitable recession seems likely in the imminent future.

2. Leader of Future Technologies

Since its birth in 1908, GM has been a top leader in its industry, producing larger variety and more efficient vehicles than its competitors. GM’s recent restructuring plan comes at time of changing consumer interests and the rise of other technologically advanced auto manufacturers (i.e. Tesla). With an increasing demand for electric vehicles (EVs) and the availability of the sustainable technology to produce such vehicles, GM is left with no choice but to adapt to these changing times in order to stay ahead of its competitors and be positioned to be a leader in future technologies. Staying profitable during a future recession will enable GM to continue research and development of the future technologies, specifically electric and self-driving vehicles. GM announced that it plans on releasing 20 new all-electric vehicles by 2023 and at least 10 in China by 2020. Also, staying profitable allows GM to continue investing in R&D for their already expensive subsidiary GM Cruise, a self-driving unit acquired in 2016. Plans of Dan Ammann, current GM president, leaving his current position and becoming CEO of GM Cruise and $5 billion in investments from SoftBank and Honda conveys how serious GM is about developing self-driving technology and what a lucrative future business it is. GM Cruise plans on launching self-driving taxis in San Francisco by the end of next year, staying ahead of Alphabet Inc’s Waymo, Uber, and Lyft and with a current evaluation of $14.6 billion, many analysts believe its long term value can triple.

Similarly, GM wants to expand future production not only in all battery powered vehicles but also Hydrogen fuel cell vehicles. The difference? While battery powered EVs take time to charge, and fuel cells EVs can be charged in minutes, last longer and are more powerful. Fuel cells make sense in certain applications where battery packs would be too big and heavy, or when recharging times are critical. Perfect customers include SUVs and long distance trucks, first responders that can not afford out of service vehicles for hours to recharge (ex. ambulances), and the US Army that have their own fuel stations and ability for manufacturing renewable hydrogen fuel. Along with its broader electric fleet of vehicles, GM has created a joint venture with Honda to mass produce fuel cells by 2020 and has made it clear that hydrogen will play a big role in its future as well, adding to GM’s commitment for the future in technology. GM’s plans are in line with the direction of the industry. GM is pioneering these radical changes and the competition is or will follow. Volkswagen AG aims to have EVs represent a quarter of its sales by 2025, Nissan and Renault will launch 12 new EVs by 2022, and BMW will launch 12 new fully electric models with mass production beginning in 2020. A reorganized GM will gain a competitive edge in the future, while also prompt its competitors, like Ford Motor Company and others, to make similar internal changes and follow in GM’s footsteps.

3. Factories were unprofitable

The likely reason that GM closed down 5 of its manufacturing plants is because they were unprofitable, or soon to be. With sedans sales falling, these plants – which specialize in producing finished sedans or transmissions – have had their production and labor hours cut. One of the factories located in Ohio builds compact Chevrolet cruze sedans, while cruze sales over the last year have fallen by more than half, it leaves GM little reason to keep the plant running while it approaches its break-even point and eventually begins to lose money when their marginal costs exceed their marginal revenue. While GM is scaling back on cars, it is not scaling back on all passenger vehicles. In fact, SUVs and trucks continue to dominate the market, accounting for two-thirds of vehicle sales in 2017. Low gas prices explain why American car buyers see little reason to not purchase a more flexible and larger vehicle. Ford similarly announced it would stop building cars in North America and would invest more capital in pickups and SUVs, while Fiat Chrysler began to phase out sedans in 2016. With sales also down in China (the world’s largest car market) for the past 5 months and on track for their first annual drop in 20 years, GM is unable to rely on China’s steady growing demand for vehicles and further explains GMs restructuring plan and closing of plants in North America, and possibly in China. The closing of the 5 plants as well comes as a benefit and obvious goal: to boost free cash flow. GM forecasts that the halt of its 5 plants will boost their adjusted free cash flow from roughly $4 billion in 2018, to $10 billion by 2021, enabling GM to focus on investing more in its future vehicles and endeavors.

4. High Costs and Trump

Since the decisions of GM, President Trump has been distressed and fueled with anger to what he believes to be betrayal. Remembering how the government saved GM from collapsing, Trump looks down upon GM’s decision to close factories and lose thousands of American jobs which counters his promises during his political campaign. In hindsight, Trump can partially be the one to blame for GMs actions due to his role in trade wars with China and urge to pass import tariffs. These high tariffs, specifically on steel and aluminum, total over $1 billion in costs for GM in 2018 and are likely to increase in the upcoming years with unclear trade war outcomes, which puts more pressure on the company to cut workers and likely pushed GM to their decision of restructuring. Similarly, Trump’s threats to strip GM of any US government subsidies may sound menacing but in reality will most likely make things worse. Cutting GM subsidies will likely make future vehicles more expensive, hurting auto manufacturing in the US. As well, higher auto import tariffs are likely to fail because they historically result in a net loss of US jobs, lower car production, offshoring of car manufacturing, and a significant hit to the US economy. Lastly, even though thousands of jobs are lost, many are offered opportunities for work in other high demand manufacturing plants.

Conclusion

We believe with GMs wise decisions of switching from an old gas powered vehicle manufacture to a new modern and future oriented company will show great success for the company and stock price in the next decade. The idea that the future of cars is coming seems as certain as ever. GM will no longer sell unprofitable vehicles just to hold market share but plans on becoming a long term leader in both EVs and autonomous vehicles. Through the next recession, GM wants to ensure it can continue to fund future advanced technology product programs, and while its business hits speed bumps as markets slow, GM has proven its well prepared to stay ahead of its competitors in the future which emphasizes its great potential within the next decade.

Vodafone: Is It Finally Time To Buy?

By Stephen Kletscher

Company Overview

Vodafone Group Plc (NASDAQ:VOD) is a global telecommunications company that operates networks in 72 countries around the world. Although it is based in Europe (74.7% of revenue), Vodafone has operations across Africa and Asia (12.7% of revenue), including a substantial presence in South Africa (12.6% of revenue).  Vodafone has the 4th most mobile customers in the world with 536 million customers. It generates $63 billion in revenue with a market capitalization of $58 billion. Vodafone has recently expanded into cloud and security services for both public and private cloud.

Investment Thesis

As of 21 December 2018, Vodafone Group Plc is trading for $19.46 per share. The price has declined 39.4% YTD and 9.2% in December 2018. It has steadily decreased in share price by 40.8% for the past five years (Figure 1). Due to this selloff, Vodafone has a sustainable dividend yield of 8.92%. This makes it one of the top yielding stocks in the market.

New management is implementing a cost efficiency savings plan that focuses on reducing operating costs and generating better returns from current infrastructure. To help offset the high fixed costs of owning and building towers, management is focusing on renting out masts by forming joint ventures with other telecommunications companies. Vodafone has reduced costs for three years in a row. Management thinks it can reduce operational costs by $1.52 billion in just Europe with an operating cost reduction target of 13% (Figure 1).

Additionally, Vodafone will not increase its dividend in the immediate future in order to provide more free cash to reduce its substantial debt of $39 billion. However, it will continue to pay the current dividend with no intention of cutting it. It is expected to increase free cash flow from $5.2 billion to $5.4 billion in 2019 driven primarily by cost cutting. Vodafone has a 1.35 ratio of free cash flow to dividend payouts, which shows that it has the cash flow to sustain the current dividend. It also has a 4.0 interest coverage ratio. Vodafone’s debt is primarily long-term and covered by an operating cash to debt ratio of 29.32%. Despite a significant amount of debt, I believe that the dividend is safe. New CEO Nick Read is the former CFO of Vodafone and has indicated that the dividend will not be cut. In fact, he has previously stated that the dividend would increase once debt returns to the lower end of a target range. Although the debt is substantial, this is typical for telecom companies with the need for large investments in infrastructure, particularly as Vodafone continues to invest in building out its 4G/5G network. Vodafone has a debt to equity ratio of 0.8, which is lower than competitors such as Verizon (1.90) and Deutsche Telekom (2.007). Vodafone also has a lower P/E ratio (10.86) than the telecom industry average (12.89) and competitors Verizon (17.91) and Deutsche Telekom (20.11). Vodafone is at a relatively cheap valuation compared to peers. It has an EBITDA multiple of 6.58 compared to a 7.17 for Verizon, 6.53 for Deutsche Telekom, and 12.07 for the telecom industry as a whole.

Previous years of significant M&A activity have caused an inefficient and overly bloated company. The company is currently struggling to deal with the issues of integrating several previous acquisitions such as KDG in Germany, ONO in Spain, and Ziggo in the Netherlands. Management plans to reduce $612 million in costs through synergies of acquired companies. Vodafone has a strong track record of cost saving synergies in previous acquisitions. New management plans to restructure the company by selling off underperforming assets and reducing costs of companies in less profitable markets. By selling off underperforming assets Vodafone will increase free cash flow to invest in more profitable areas and reduce debt.

Despite recent issues in Spain and Italy, significant EBITDA growth continues in key areas. Key markets such as the UK and Germany had half-year EBITDA growth of 12.1% and 7.3% respectively. Due to strong competition causing losses in Spain and Italy, half-year EBITDA growth was only 3% and top line growth was only 1%. Cost cutting measures in Spain and Italy should increase profitability while shifting cash towards more profitable markets. Revenue in high future growth potential emerging markets was up 7.4% in Q2 of 2018.

Investment Risks

Vodafone is based in England and is one of the largest companies in the FTSE 100. Because a majority of its business is in the Eurozone, Vodafone is sensitive to a potential “hard Brexit.”  Brexit will affect the ability of Vodafone to recruit from the broader European talent pool. A “hard Brexit” could also result in data redirection from the UK, meaning Vodafone would have to relocate data centers to somewhere in the Eurozone. The previous CEO of Vodafone had indicated that Brexit may cause Vodafone to shift its headquarters to mainland Europe, which would result in the additional costs that come with moving headquarters. However, these costs are unlikely to be too substantial because Vodafone already has substantial offices in Germany that they could expand.

In May of 2018, Vodafone agreed to a deal to purchase Liberty Global’s Germany and eastern Europe assets for $21.8 billion. This deal is now facing a full EU antitrust investigation. The EU may prevent the deal from going through, causing some uncertainty with the company’s future. The stock has performed poorly since the deal was announced, declining 31.6%. I believe that the market has priced in the deal and the substantial debt that accompanies it.
The significant debt of Vodafone is a substantial concern for the future of the company. Total debt is currently $49.79 billion. The acquisition of Liberty Global will add more to the debt. Although management has a solid plan in place to focus on debt reduction, the debt load is significant and will continue to weigh heavily on the balance sheet in the future. As mentioned previously, the debt is well covered by a 29.32% operating cash to debt ratio and 4.0 interest coverage. It also has a 1.35 FCF to dividend payouts ratio, meaning dividends are covered as well.

Recommendation

The overall recommendation Vodafone Group Plc is a buy. Although there are some reasonable concerns with Brexit and the substantial debt load of acquiring Liberty Global, I believe that this stock has been oversold. Vodafone has a solid plan to turn itself around with a new CEO focused on reducing costs and debt. It has great earnings growth in significant markets such as the UK, Germany, and emerging markets. The strong growth outlook and significant cost efficiency measures suggest a positive turnaround for the company. I have a price target of $26.48, which represents a 36% upside without counting the dividend. I think that Vodafone is a solid long-term buy and hold stock as it continues to cut costs and increase growth in high potential emerging markets. With the high dividend yield and strong growth potential, I believe that Vodafone is a compelling value opportunity.