By: Shayan Moazeni
You are on a random walk down some street (let’s say it’s not Wall Street). You ask a random stranger for stock ideas. Off the top of their head, they will recite the FAANGs — large household companies like Amazon, Apple, and even Microsoft. At first sight, a stock that the Average Joe recommends is likely not a clever investment. But Microsoft continues to profitably reach for the clouds.
Microsoft (NASDAQ: MSFT) has had quite a year: its stock is up 46% (YTD) and it has won two government contracts, worth a total of $17.6B over the next ten years, to provide the federal government its dominant hybrid cloud product. Azure, its cloud system, is the competitive advantage that, along with the unique breakdown of Microsoft’s revenue, transforms the company from just a “bandwagon” buy to a calculated investment. I will analyze both of these points in the rest of the article.
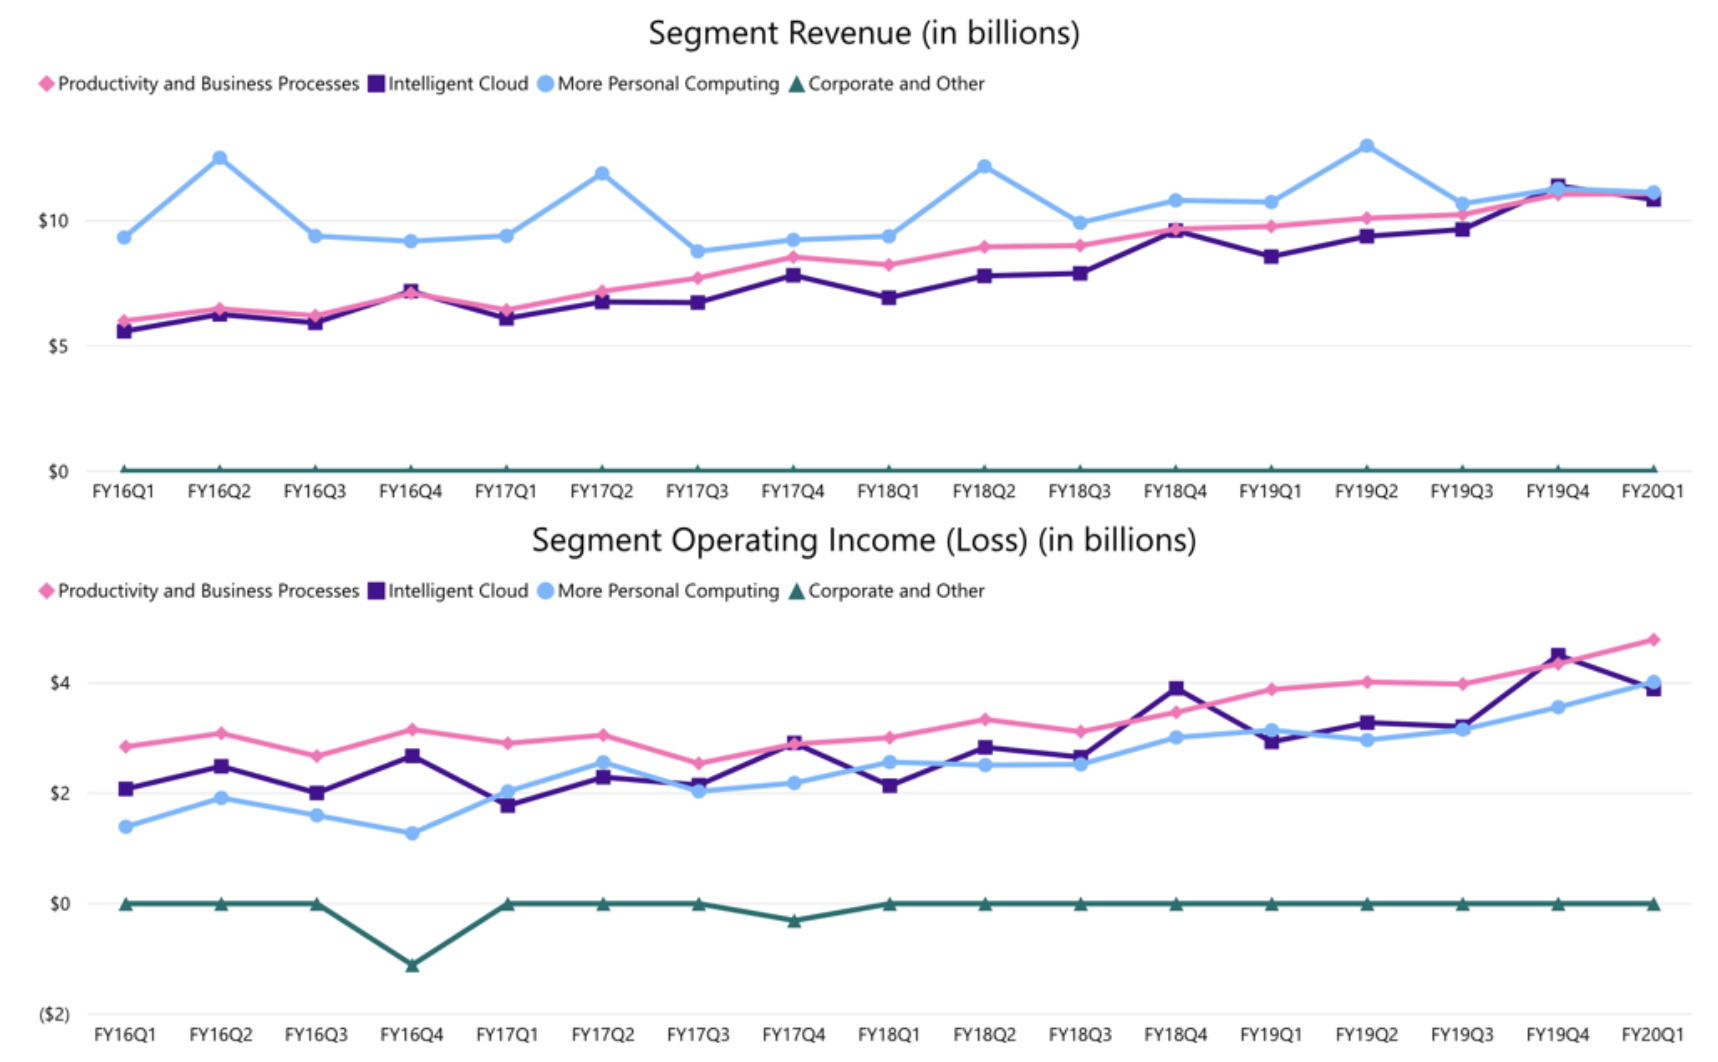
Figure 1
A Deeper Dive Into The Business
Microsoft’s revenues and operating income are both up 21% (YoY) this year, but what makes this growth more impressing than that of, say, Apple, is the structure: while over 52% of Apple’s revenues come from the iPhone, Microsoft’s cash flows stem almost perfectly evenly from three segments: “Productivity and Business Management”, “Intelligent Cloud”, and “More Personal Computing.” This even distribution of income greatly reduces the risk of revenue loss from a single product, putting the firm in the best position for the long run.
- In Productivity and Business Management, revenues are up $1.3B (13%) for the quarter, $807M of which is from Microsoft Office (a 13% increase), and $379M of which is from Microsoft’s new acquisition, LinkedIn (a 25% increase, already proving to be a smart investment). These two platforms have helped the 16% increase in gross margins in the segment, leading to an impressive 23% increase in segment operating income.
- In More Personal Computing, revenues are up $387M (4%) for the quarter, lifted by a 9% increase by Windows and 11% increase in search advertising, while gaming revenue is down 7% due to the cyclical nature of the sales of the Xbox (revenues from hardware sales are down because the latest Xbox was released in 2013, but content and services revenues are unchanged). Operating income increased 28% due to a shift to higher margin businesses, among other things.
This brings us to the main focus point of the article, Microsoft Azure, which currently accounts for 32.8% of Microsoft’s revenues. Running on a 36% operating margin, revenues and operating income from Azure are both up 21% (YoY) thanks to the strong hold Microsoft has on the cloud market, with a market share of 17.7% in 2018 and 18.2% in 2019. As mentioned before, Microsoft has also secured two contracts with the federal government for its hybrid cloud system, adding $633.6M to its annual operating income over the next 10 years. The hybrid cloud allows users of Azure with sensitive information to secure most of their information on the cloud system but keep certain bits of the data offline to prevent Microsoft, hackers, and other third-party users from accessing the information. By fixing this issue, Microsoft has opened its cloud system to hundreds of potential clients who may have previously been hesitant to storing their data on Azure.
An analysis of the market for cloud supports this. As Gartner reports [1], the annual revenue generated from cloud activities across the market is predicated to grow from $214B in 2019 to $331.2 by 2022, a 55% increase.
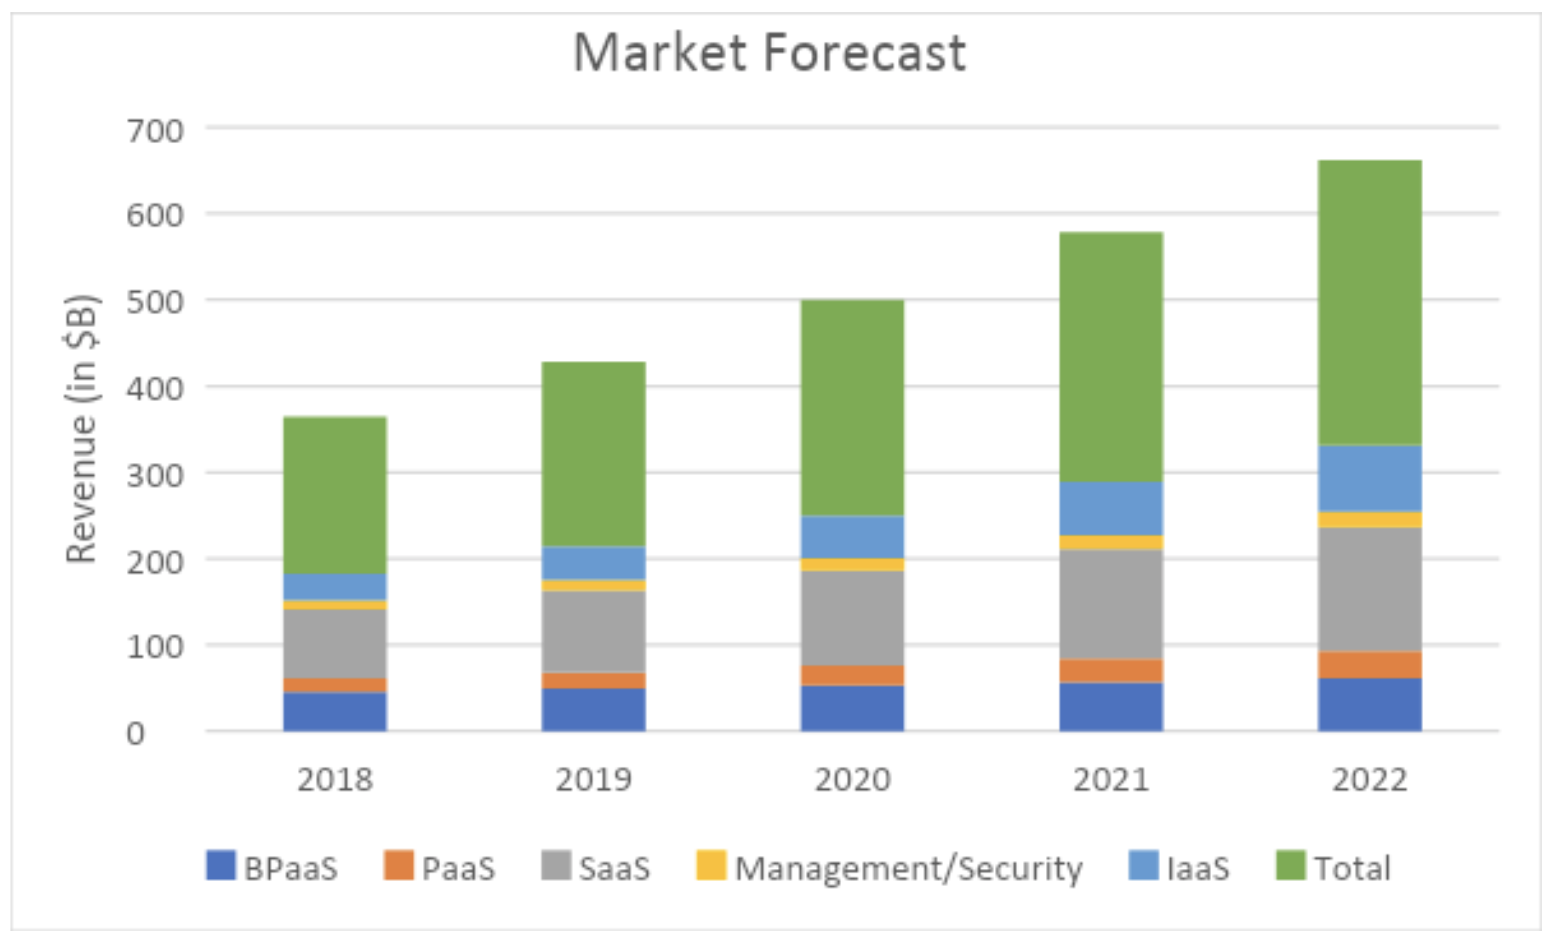
Figure 2
Valuation
In the first two segments, not much is expected to change for Microsoft save for the release of the new Xbox in 2020. Since Microsoft’s margins are surprisingly low on the Xbox hardware [2], the release of the new Xbox will not have a significant impact on the net cash flows to the company and gaming EBIT will continue to mostly stem from subscriptions and games, which are not subject to much change. For this valuation, despite the impressive growth in Productivity and Business Management and More Personal Computing segments (average growth of 24% and 23% respectively), I will assign a conservative 20% annual growth to those segments through 2022.
Finally, the cloud business. According to the aforementioned market forecast data, total revenue generated in the cloud business grew 17.5% from $182B in 2018 to $214B in 2019. In the same year, Microsoft’s cloud revenue (and EBIT) grew 21%, asserting its dominance over the cloud market. Due to Microsoft’s strong hold on the market, it is reasonable to expect this trend of beating the cloud market to continue. Below is a numerical summary of figure 2 along with Microsoft’s expected revenue from its (linearly) growing market share as well as Microsoft’s expected EBIT (using it’s consistent 36% operating margin) which also includes the annual $633M income from its two government contracts.
| Segment/Year | 2018 | 2019 | 2020 | 2021 | 2022 |
| Total Market Revenue | 182.4 | 214.3 | 249.8 | 289.1 | 331.2 |
| MSFT Market Share | 17.70% | 18.20% | 18.70% | 19.20% | 19.70% |
| Microsoft Rev | 32.23 | 38.99 | 46.7126 | 55.5072 | 65.2464 |
| EBIT (with gov contract) | 11.52 | 13.92 | 17.45 | 20.616 | 24.122 |
| Growth (YoY) | 21% | 25% | 18% | 17% |
Figure 3: all raw values are in billions of dollars
As the model suggests, Microsoft’s operating income from cloud will double by 2022. Using this value and the expected growth in the other two segments, I predict Microsoft’s future EBIT as follows:
| Segment | Business | Cloud | Personal Comp | Total |
| EBIT | 29.6 | 24.12 | 23.6 | 77.3 |
Figure 4: all values are in billions of dollars
Using the consistent EV/EBIT ratio of 23 for Microsoft in recent years, this yields the following values for enterprise value. With a steady net debt of $50B, I have estimated the following values for market cap (EV+net debt) and thus share price (with 7.7B shares outstanding).
| Enterprise Value | Market cap | Share Price | Return |
| $1.778.9T | $1.828.9T | $237.5 | 59% |
Figure 5:
One obvious question here is whether the current EV/EBIT of 23x is an overvaluation. Below are the share price and EV/EBIT ratios for Microsoft and Apple.
If Microsoft’s EV/EBIT catches up to its share price in a similar manner to Apple’s, we can expect a multiple over 30x according to the graph, which can result in the following valuation in 2022:
| Enterprise Value | Market cap | Share Price | Return |
| $2.320T | $2.370T | $307.8 | 106% |