By Michael Medvedev
—
First of all, thank you for taking the time to read Williams Insight. I am hoping that this article will give you a nice break and move your focus away from COVID-19 and the world economic crisis. As we have all been home for the past month, adjusting to our new ways of life, watching Tiger King and Love is Blind, solely relying on pushups, squats, and daily bike rides to stay lively, I took it upon myself to research an up and coming, ever popularizing, streaming device called “Roku.”
What is Roku?
Roku is the 2nd best-seller on Amazon in the electronics category (below the Amazon streaming Fire stick, unsurprisingly) and has been making a lot of noise in the video streaming world in the past two years. The California-based company started as a unit of Netflix, making the company’s first set-top box. In late 2007, once Netflix adopted a hardware-agnostic strategy, it divested its Roku business.
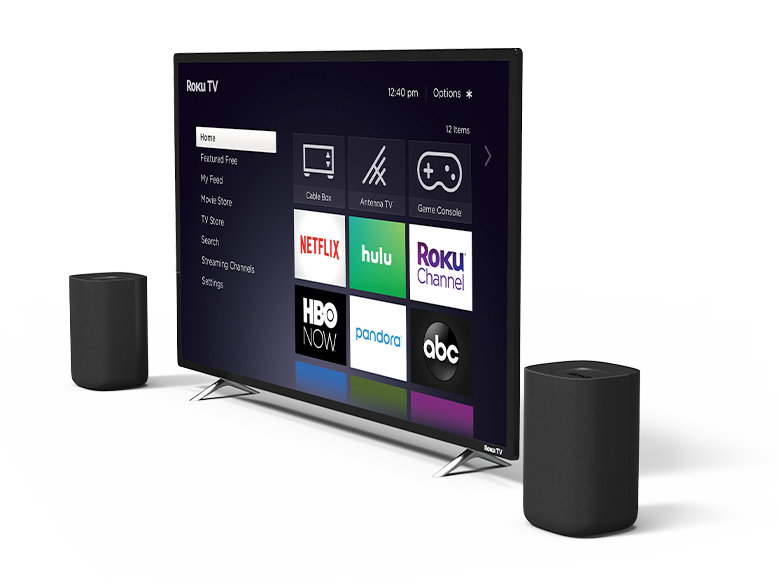
Simply put, Roku allows you to watch video content on your TV via the internet. Think Netflix, Amazon, Hulu, Sling TV (if you watch that), Youtube, other video streaming services, hundreds of TV shows and movies all in one place, on one TV — no subscription fee required. In addition to paid-content options, there are dozens of free sources (ex. Youtube, The Roku Channel, and of course the good ol’ web browser). Besides being a single streaming platform, Roku is easy to set-up with user-friendly buttons, graphics, search engines, has a variety of channels (American and International) as well as games, media libraries, and security cameras in addition to streaming. Essentially, Roku combines the best of cable with streaming platform offerings, making it a destination for all entertainment content. Sign me up!
Roku devices can be connected to any TV with HDMI connection and start at $30, going up to $100 for higher-end models. Company revenue stream comes not only from device sales, but also from software licensing to third-party companies, mostly to TV manufacturers such as TCL, RCA, Toshiba, and Hisense. In fact, in the first 9 months of 2019, 1 in 3 smart TVs sold in the US came with Roku OS. During 2019, the company’s fastest-growing source of new accounts was licensing arrangements and relationships with brand partners and service operators, which collectively accounted for 56% of new accounts, up from 50% in 2018.
Management team
Roku’s management is solid and experienced. Anthony Wood, Roku’s founder, chairman, and CEO is a video industry veteran, known as the man who invented the first DVR. He founded Roku in 2002 and has been its CEO since. His leadership team consists of seasoned industry executives, with Scott Rosenberg (Senior VP) and Matthew Anderson (CMO) both having extensive entrepreneurial experiences and passion for the video streaming industry.
Revenue
Roku has 3 main streams of revenue:
- Direct Sales of Hardware and Accessories to distributors, retailers, and DTC, accounting for 37% of net revenue last quarter.
- Licencing OS to TV manufacturers allowing them to offer Smart TV with content at competitive price points.
- Ad-supported Video on Demand (AVOD) – the main revenue driver for the company.
- Roku’s recent acquisition of Dataxu will make it easier for mid-sized advertisers to buy ads on Roku TV platform and serve a wide array of advertisers.
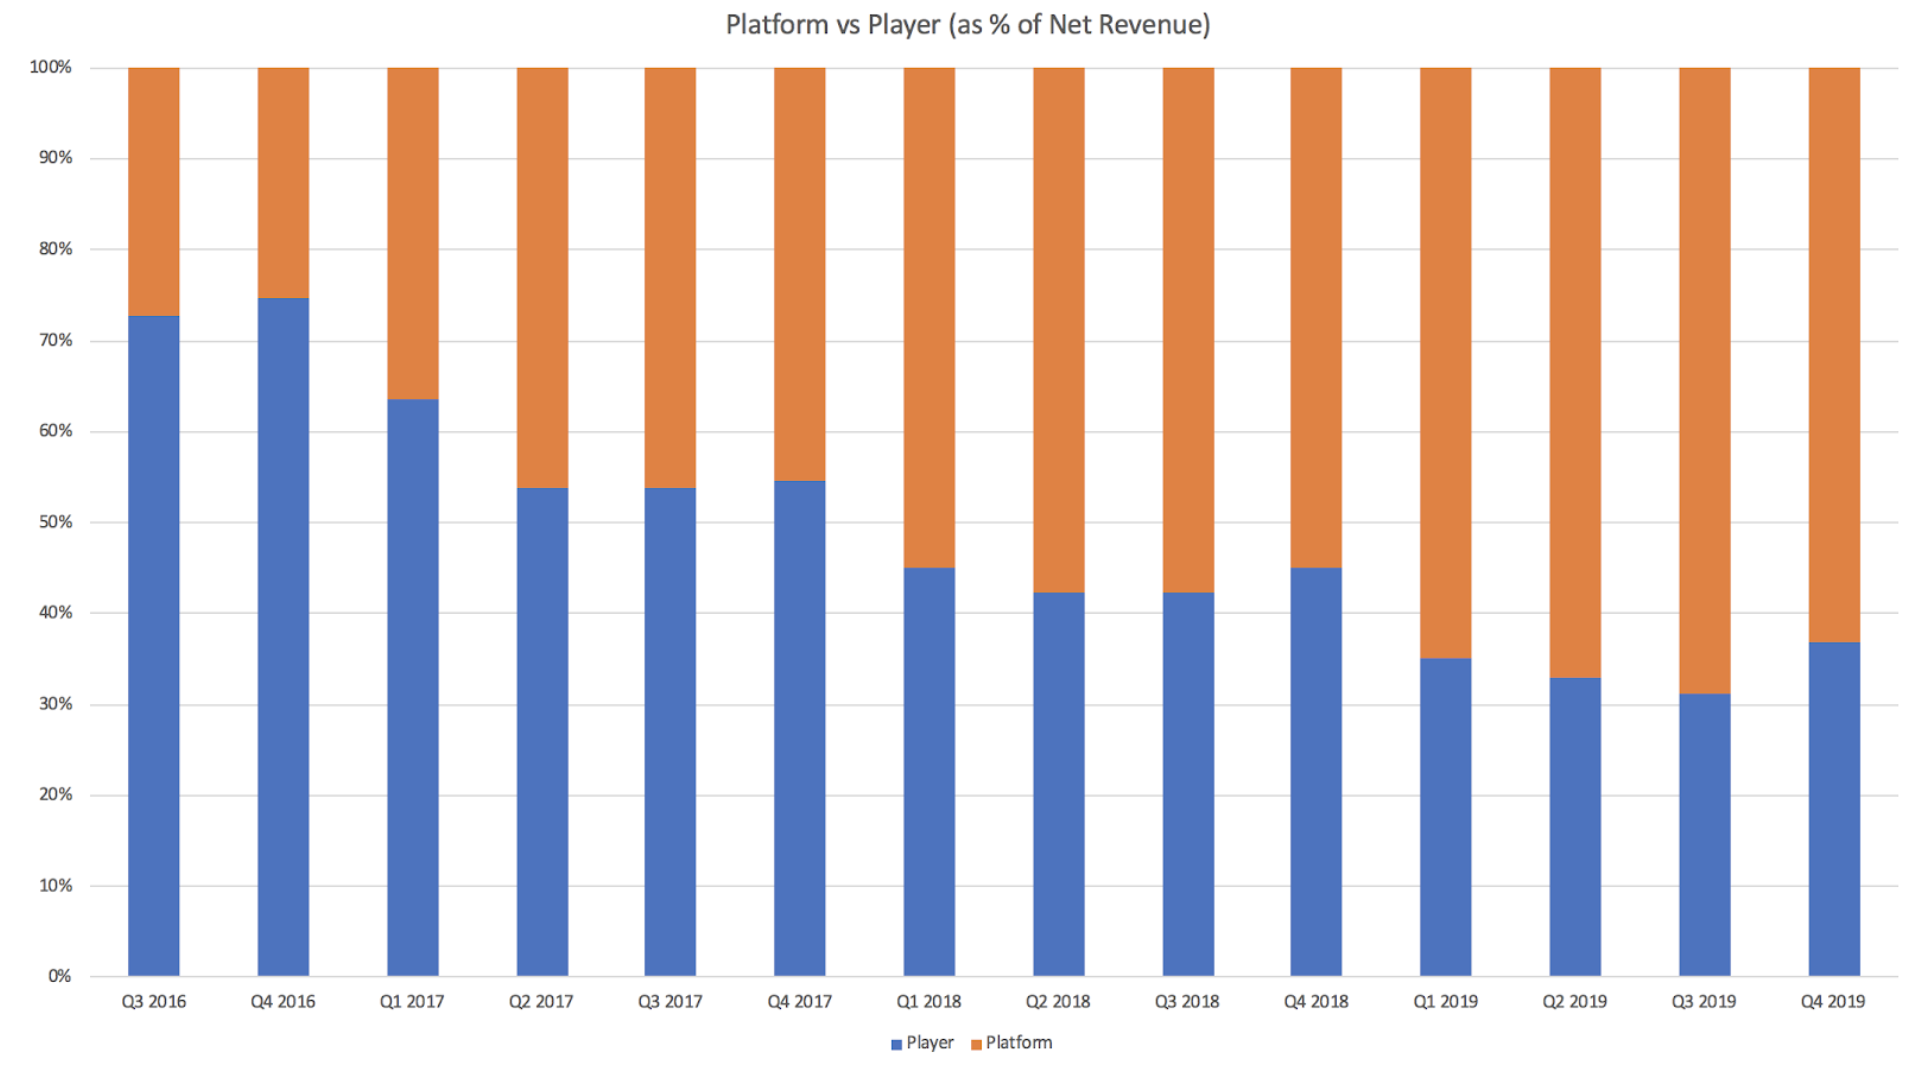
Roku generated $1.13 billion in revenue in 2019, a 52% increase from 2018. Roku’s gross profit was $495.2 million in 2019, a 49% increase from 2018. The company projects $1.6 billion in revenue by the end of 2020. From the above streams, the first category is listed as revenue from “player,” and the bottom two are listed as revenue from Roku’s “platform.” Having originally focused on player revenues and profit, Roku is now selling its hardware at cost (i.e. with 0% gross margin) and using its hardware as a vehicle to boost revenues through its platform.
One of the key offerings from Roku is The Roku Channel: a free channel offering hundreds of free TV shows and movies. Roku sells a wide range of ad inventory offerings inviting users to engage with brands. The Roku Channel has become a leading source of advertising inventory, and is an integral piece of Roku’s strategy to grow platform revenue and improve profit margins. The company reportedly commands $30 per 1,000 impressions, which is one of the highest rates in the media industry. To further drive user engagement, Roku also recently launched Premium Subscriptions that give users the option to access ad-free premium content from many streaming service providers. Lastly, Roku takes a cut if a user signs up for Netflix or any other streaming service through a Roku device, allowing them to profit from rival streaming services. Cha-ching!
International Expansion Opportunity
Roku’s revenue is highly concentrated in the United States, with 90% of its net revenue being domestic. In 2020, Roku is ready to capitalize on the international retail distribution, content, and manufacturing relationships it started building in 2019. Its first big expansion was in Brazil in January of this year. The company announced partnerships with AOC and Globoplay for new smart TVs, and will be bringing a lineup of streaming channels, movies, TV series, as well as Roku players to the country. Just this month, Roku announced it is making another big investment in Europe, by expanding The Roku Channel to the U.K. Roku is also increasing its market share in Mexico and Canada.
Compared to 39% market share in the US, Roku has only begun to enter the international arena. The global smart TV market size reached $183.6 billion in 2019 (119 million units) and is expected to grow to $292.55 billion by 2025 (293 million units) at a CAGR of 9.5% — another industry tailwind.
Great user monetization
Roku tracks 4 key metrics to assess its business model: revenue, active accounts, streaming hours, and ARPU. The number of active accounts, or active monthly users, has been increasing tremendously. Roku’s user base expanded 36% in 2019, adding a record 4.6 million active accounts in its last quarter, closing out the year with 36.9 million active accounts. 11.7 billion hours of content streamed through Roku’s platform in its latest quarter is up 60% year-over-year. This determines Roku’s advertising inventory and sell-through rates. And lastly, ARPU was $23.14 over the trailing 12 months, a 26% increase from 2018. Roku can increase both the value and the number of its customers.
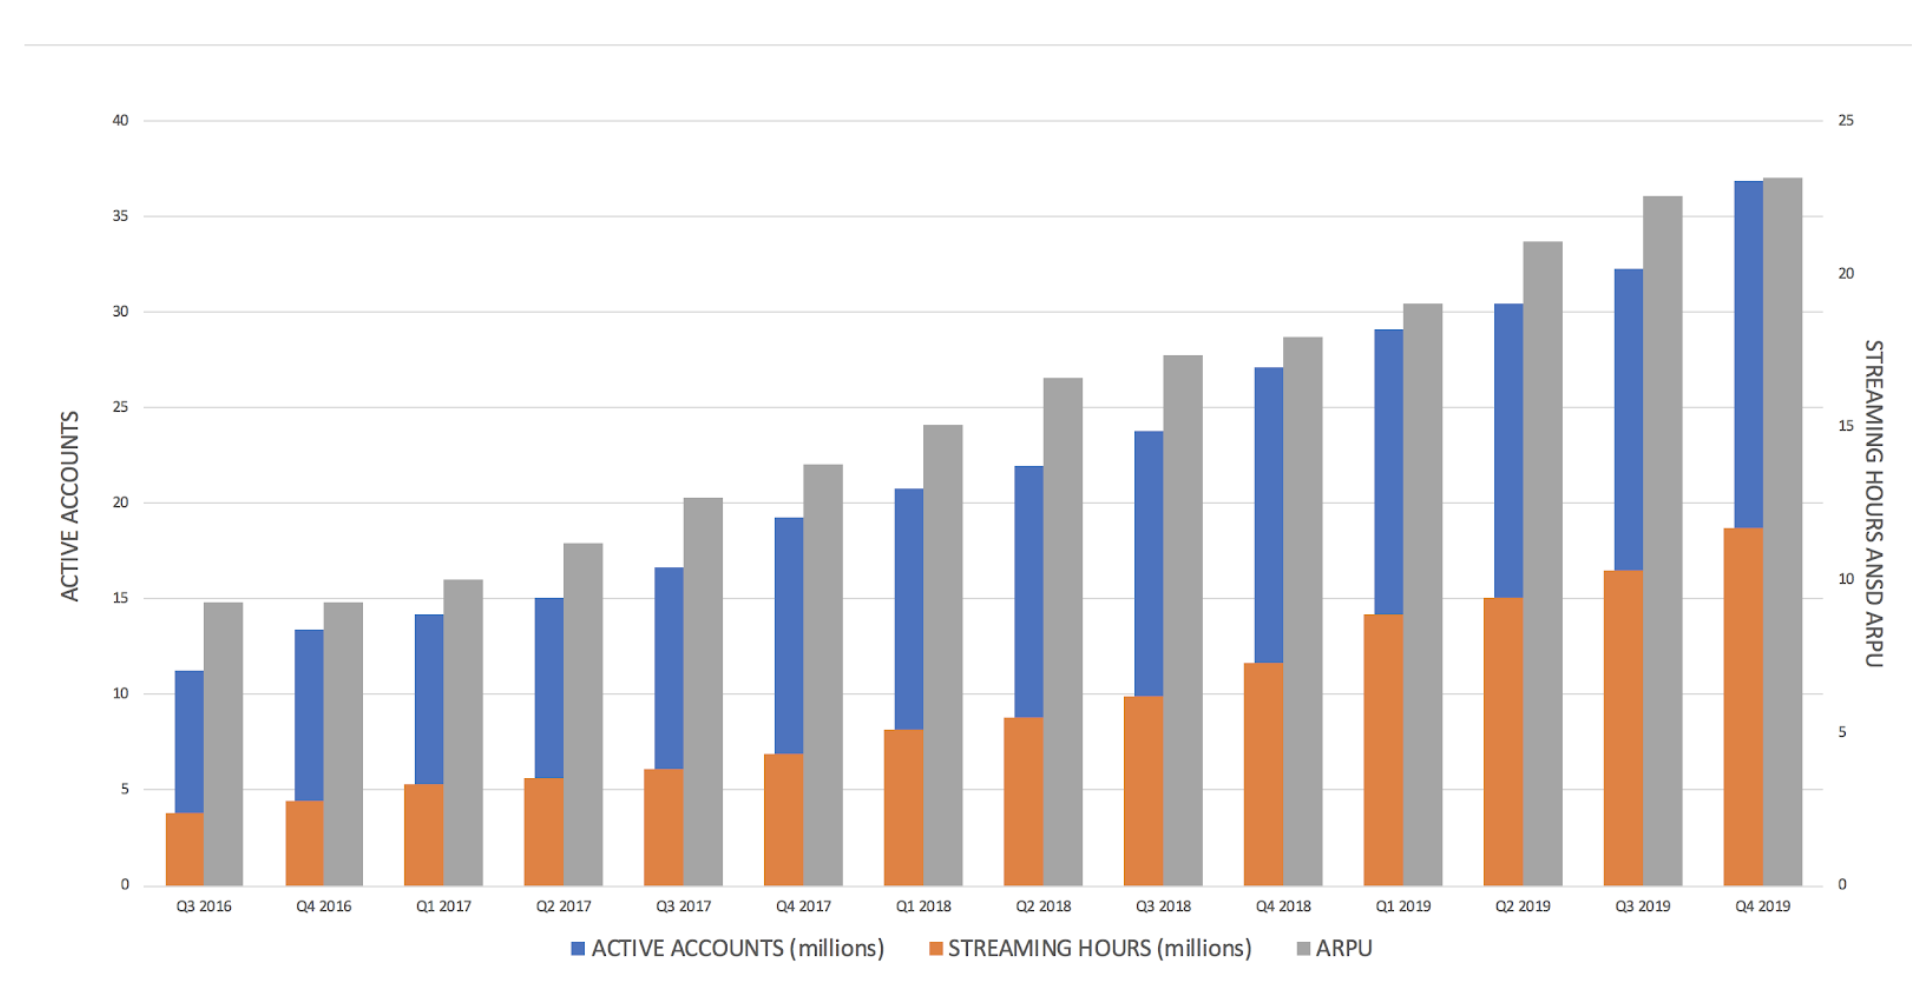
Another industry tailwind — it is estimated that 56 million households will have canceled cable or satellite TV subscriptions by 2023, a 14 million household increase from today. We expect to see the number of active users and ARPU increase dramatically as more people move towards streaming in the decade ahead.
Great growth financials
It is also important to mention that Roku has changed its focus from set-top boxes to media software, which produces wider profit margins for the company, expanding future equity multiples. This year, sales from the platform unit surged 86%, compared to a 24% increase from the player side of business last year. Roku says they are no longer focusing on sales from its players segment, but rather working to maximize account growth and ad sales. “Player revenue and player gross profit may decrease over time as we strategically aim to acquire new users through the sale of lower priced streaming players.” – Roku 2020 10-K. We expect that the tradeoff from player gross profit to grow active accounts will result in increased platform monetization and gross profit.
Roku also has a healthy amount of cash. As of December 31, 2019, it had $515.5 million in cash and cash equivalents, a 233% increase year-over-year. Roku believes that its existing cash balances and cash flow from operations will be sufficient to fund its working capital and meet anticipated cash needs for the foreseeable future.
Risks and Competitors
The TV and video streaming industry is larger than ever and continues to grow. Roku is still a $10 billion company disrupting a $140 billion linear TV advertising industry with strong gross margins.
Roku’s primary competitors are Amazon’s Fire Stick and Apple TV. Roku stands out and has proven to be the leader in the industry in a number of ways.
-
- Amazon’s streaming product is currently in 180 more countries than Roku (200 vs. 20), but both companies have similar numbers of active accounts. This gives Roku great international growth opportunities.
- Roku’s advertising platform model is unique. While Roku has stepped back from its focus on player deliveries, and as more people become attracted to Smart TVs, Roku will continue to generate ad revenue from an increasing customer base.
- Roku’s options of free media are major reasons as to why customers are attracted to Roku as opposed to its competitors. Roku has become one of the most economical ways to stream video.
- Comparing market share, Roku dominates market share for streaming media platforms. Roku has about 39% market share, ahead of Amazon’s 30% share from Fire TV and 16% from Apple TV. In the dollar share for ad revenue, Roku stands at 59% Amazon at 19%.
It would not be an investment article published in April of 2020 without the mention of COVID-19. Of course, estimates this year could change because of the uncertainty of the impact of COVID-19. The good news, however, is that consumers are limited to what they can and can not do while they are stuck at home and, fortunately, streaming TV shows and movies are among the activities that are available. We believe the COVID-19 situation may not have a significant negative impact on Roku’s revenue. In fact, we believe COVID-19 will ironically be a positive for the company and its stock as more people are staying home, generating revenue for Roku. We expect Roku to see an increase in streaming in Q1 and Q2 of 2020 as a result of COVID-19. We have seen an influx of users and downloads over the past 3 months adopting Netflix and we believe this surge will translate into Roku’s streaming hours. As of March 17, data shows that Netflix downloads in Hong Kong have doubled since January 1, while in South Korea they have risen by 33%. Similarly, Netflix downloads are currently up 100% in Italy and 50% in Spain, compared to early February.
Lastly, there is a common misconception that the introduction of new streaming services (i.e Disney + and Peacock) negatively affects Roku’s growth. In reality, While streaming services are producing more content, Roku is also thriving by streaming that content across Roku TVs. More competition and content creation within the streaming services sphere is critical to their own growth. Plus, Roku makes money from subscriptions bought via its software as well as through ads shown on its platform. Along with licensing its operating system to TV producers, Roku’s business model protects it (at least partially) from risks associated with stream-only competitors.
Business to Stock
Taking a look at Roku’s stock, there is no hiding from the fact that it trades at high multiples. With a price to sales of around 9.4 and negative earnings, there is definitely reason for an investor to look away at first glance. However, after learning about Roku’s business model, its year-over-year growth, and the aforementioned catalysts, the valuation becomes more attractive.
Profitability is on the way as Roku increases its gross margin. Gross profit margin increased to 44% in 2019, up from around 30% a couple of years prior. As gross profit margin will continue to increase with software sales, this will allow the company to reach its projected positive earnings around 2022. Roku is still reporting an adjusted loss and is focusing on growth and innovation.
Valuation – with Insight Contributor Shayan Moazeni
We decided to project Roku’s revenues for the next 8 quarters. We believe that Roku will continue to successfully launch new licensing deals with key manufacturers these next two years. Along with their plans for international expansion and a projected increase in sales as a response of COVID-19, we are very optimistic with Roku’s account, revenue, and earnings growth.
Firstly, Roku has publicly said that they will no longer be focusing on profitability from their player segment. Roku has also been spending a lot of money on Marketing and R&D the past several years. However, we believe these costs will stay the same, if not increase at a decreasing rate. Similarly, G&A has historically been increasing and will continue to increase as Roku grows.
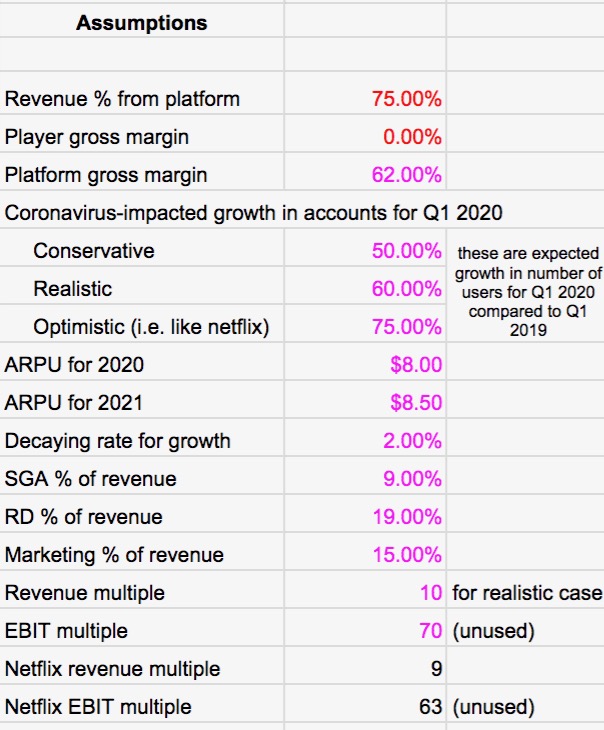
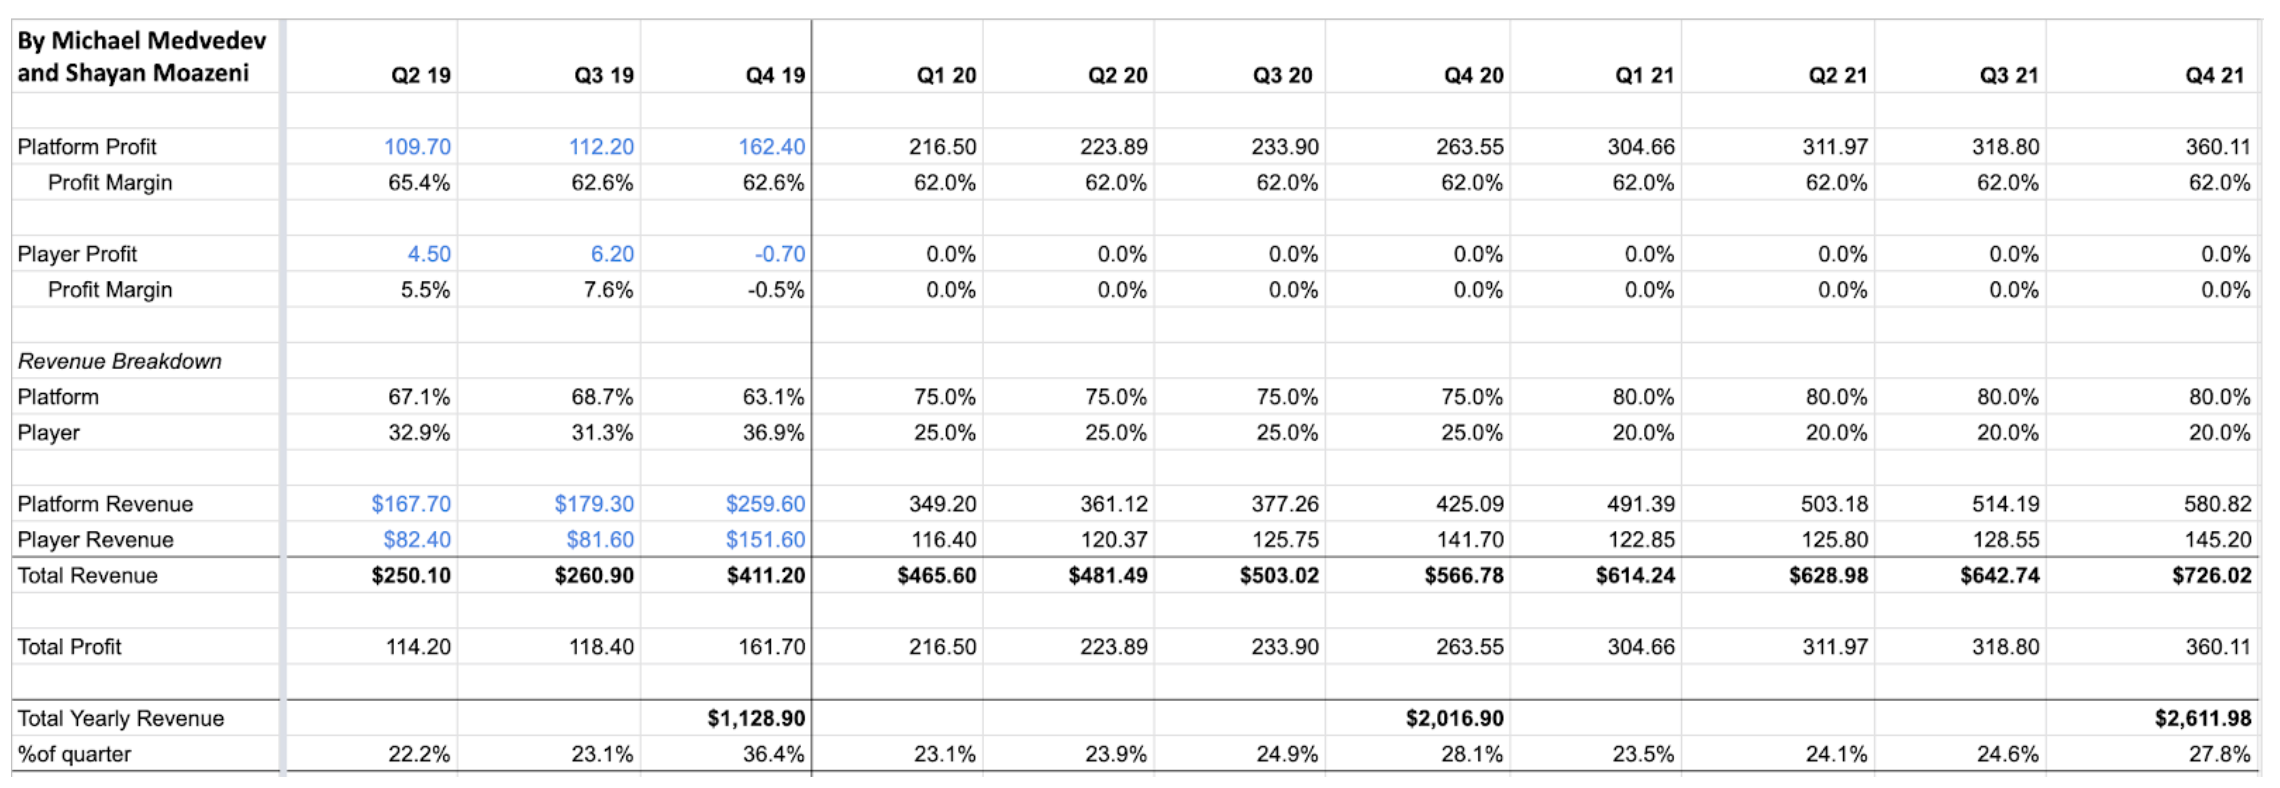
We projected that the profit margin from Roku’s platform segment would maintain around 62%, which it has historically. This margin is very conservative, as scaling up through expanding into new international markets can certainly increase profit margins. Roku expects around 75% of its annual revenue this year to come through its platform and 25% through its player revenues. Having started at 75% hardware revenues, we believe this trend will continue into 2021 and at least 80% of revenues will come from Roku’s platform. By projecting platform revenues, then, we can estimate total quarterly revenues for the next 8 quarters.
Taking a look at Netflix Q1 earnings, Netflix doubled their expectations of new subscribers due to COVID-19. We believe this will have a similar impact on Roku’s sales and account growth as well. While an equally impressive additional growth would be highly optimistic, even a much more moderate growth–as used in our realistic and conservative estimates–can have a substantial impact on Roku’s performance this year.
Roku was projecting $1.6B in revenue by the end of 2020, pre-COVID-19. However after considering the impact that COVID-19 has had on consumer tastes, we are now expecting a revenue of close to $2B in the conservative case. We projected Roku’s platform revenue by taking a look at their past quarterly account growth and projecting their account growth, as well as adding a decay rate in three Post-covid cases: conservative, realistic, and optimistic.
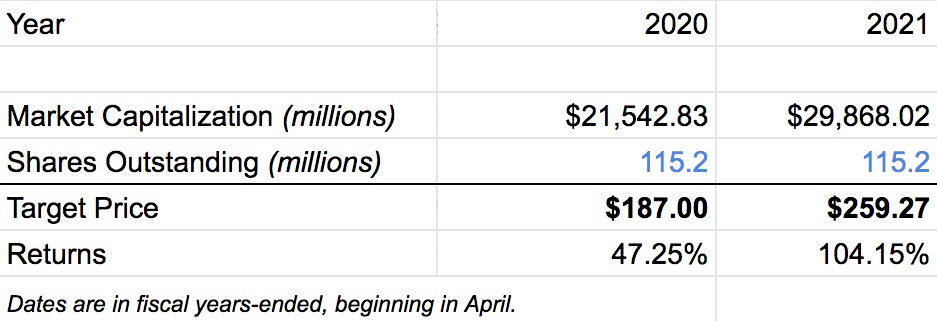
Netflix is trading at 9x market cap/revenue multiple. Roku currently trades at a 13x multiple and has traded as high as 16x in the past year–clearly optimistically valued. For our conservative estimate, given our high projections of revenue growth, we assumed this multiple can drop to as low as 7x; this multiple would make the current market valuation exactly efficient by the end of this year. For our realistic valuation, we assumed 10x, given Roku’s smaller size and more room for growth internationally compared to Netflix. For our optimistic approach, we stuck to the current 13x, providing the highest returns.
One very impressive source of growth for Roku has been revenue earned per user. As recently as the beginning of 2017, Roku was only earning around $3 per active user, a figure that has sky-rocketed to $7 now thanks to better advertising and efficiency. We expect this trend to continue and assume an ARPU of $8 in 2020 and $8.5 in 2021.
Projecting the growth in new active subscribers this year, using the ARPU, we projected platform revenues for the next 8 quarters as follows. Employing the aforementioned revenue breakdown, we calculated total revenues and expect Roku to be profitable this year–while turning a profit this quarter might be overly optimistic (as the attached model suggests), we believe turning a profit for the entire year is more than reasonable.
This yields our final, realistic valuation of Roku for the next two years.
To take a full look at our model and assumptions, as well as our conservative and optimistic valuations, please click here. Our model also predicts gross profit and EBIT, but those projections were not taken into account for our valuation.
Conclusion
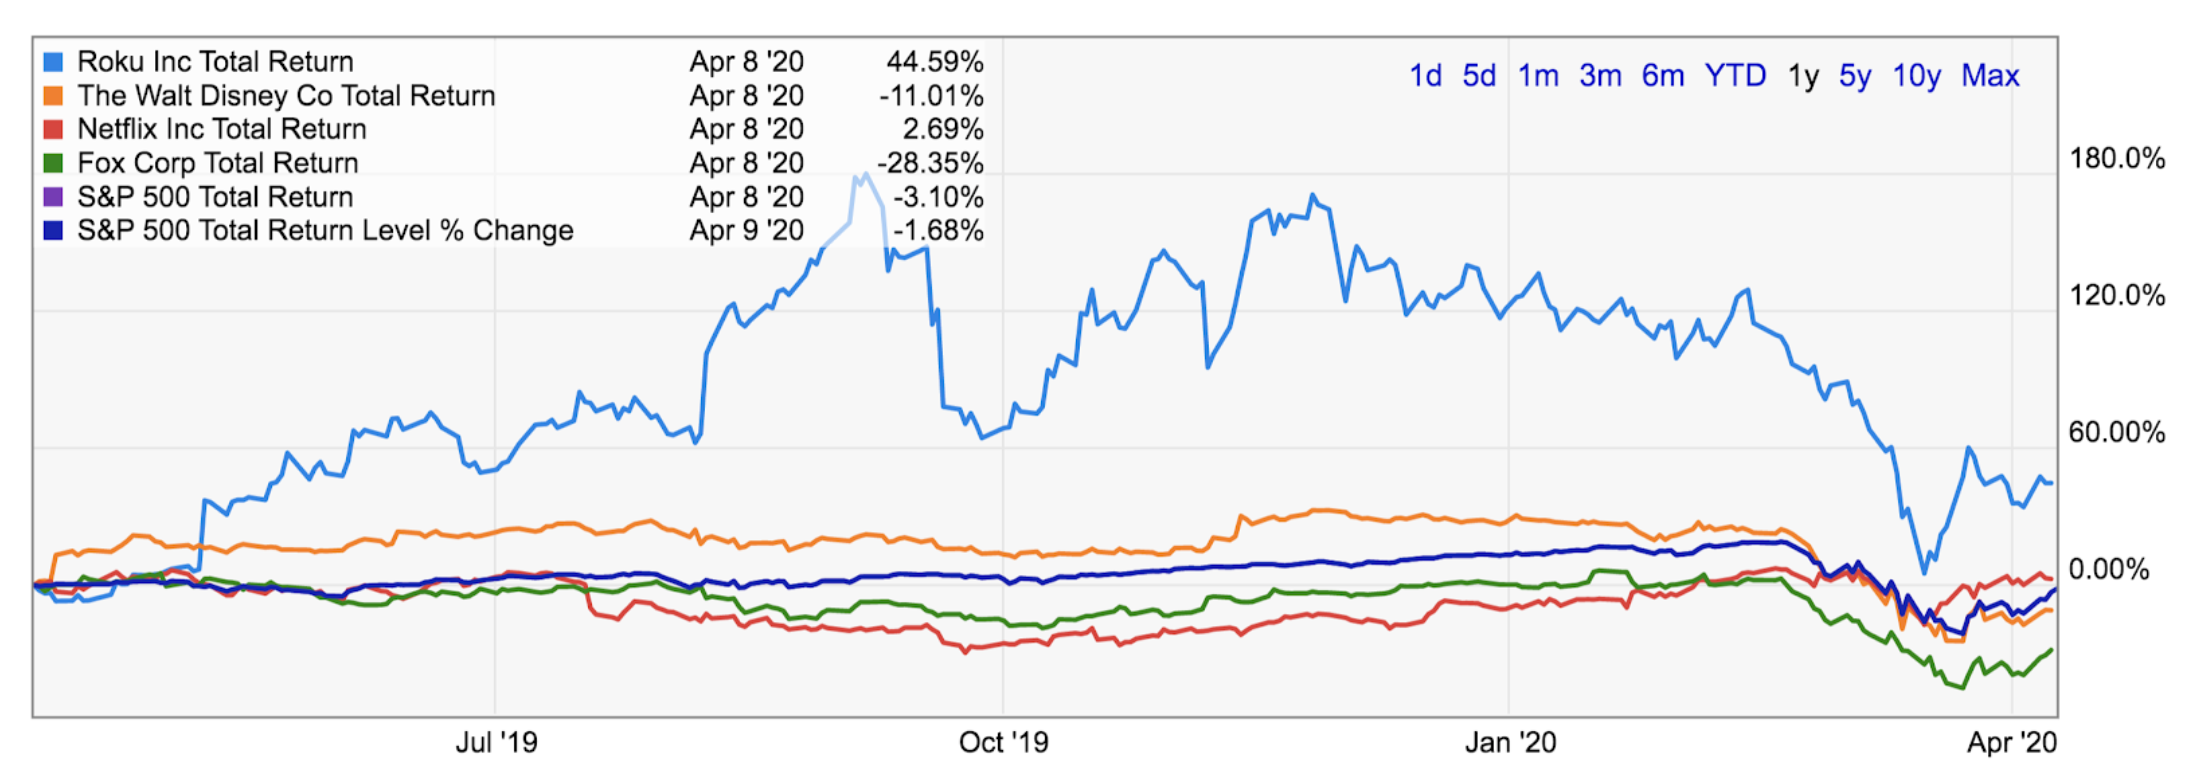
Let’s begin to wrap it up. With Roku having a heck of a 2019 year (business and market price wise – stock price quadrupling in one year), the start of 2020 has been pretty rough, as with almost everything else (unless you have been living under a rock). Roku’s shares have been cut nearly in half since peaking a little more than six months ago.
However, we know that Roku is a high-growth stock that has been focusing on expansion. We know that Roku’s international expansion has huge growth potential. Even with negative earnings now, in the long run, with little debt, strong cash flows, strong positive financial outlooks and estimates, a great AVOD business model, increasing player platform profit margins, and in an era where cord cutting is at a record pace, the wind is at its back. Our recommendation is: 1) buy for the long-term and 2) might as well buy a Roku.