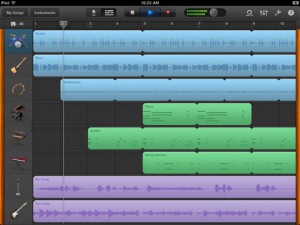
 Apple’s official how-to guide for GarageBand on the iPad 2.
Seems good.
Some Notes:

I have added a page to the site with online resources for map (and Map) related stuff — cartography and infographics blogs, map archives and the like. If you have any favorite resources that you would like to have added, send me the URL and a brief description of what you like about the site, and I’ll add it to the list.
You can find the link in the menu bar, or go there directly.
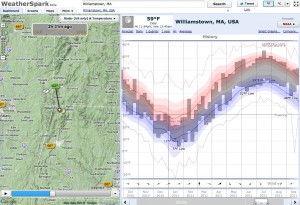
 WeatherSpark is an excellent weather data visualization tool, including radar map video, temperature histories, forecast, daily averages, historical trends, and comparative weather charts…And very attractively presented.
Here’s the WeatherSpark map of Williamstown.
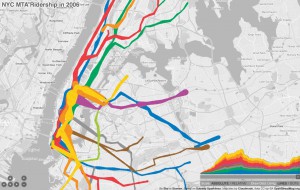
 A pretty amazing map-cum-timeline of subway ridership from 1905 to 2006, displays with either lines or dots, and allows you to scrub forward and back in time. Also check out his original blog post about making the map, and the underlying data that he got from the blog frumination (which is also pretty great, the blog of a grad student in transportation and operations research.)
DUE Thursday Sept 29

This gallery contains 5 photos.