Invisible cities of social networks

Invisible Cities
A project by Christian Marc Schmidt & Liangjie Xia

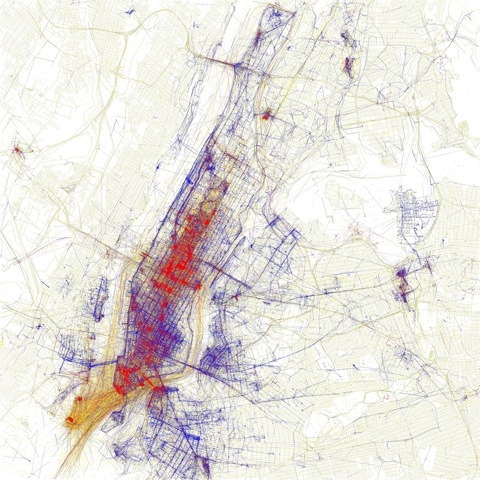
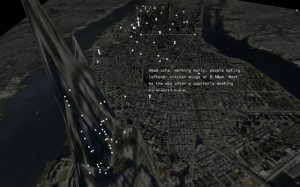
By revealing the social networks present within the urban environment, Invisible Cities describes a new kind of city—a city of the mind. It displays geocoded activity from online services such as Twitter and Flickr, both in real-time and in aggregate. Real-time activity is represented as individual nodes that appear whenever a message or image is posted. Aggregate activity is reflected in the underlying terrain: over time, the landscape warps as data is accrued, creating hills and valleys representing areas with high and low densities of data.

Continue reading

Visual analysis of Rebecca Black’s Friday

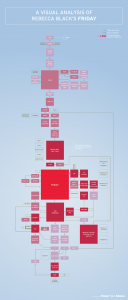
This is terribly silly, but also an excellent example of a way of mapping a passage of text, with external factors (the “memetic significance” of various passages, i.e. “How much did was that particular section mocked in the internet/YouTube/pop cultural arena?”) taken into account and given visual expression.

http://www.upload.ee/image/1269951/rebecca_black_vertical-03.png

Visual display of quantitative information: some definitions

Map (1520s, shortening of M.E. mapemounde “map of the world” (late 14c.), from M.L. mappa mundi “map of the world,” first element from L. mappa “napkin, cloth” (on which maps were drawn), said by Quintilian to be of Punic origin (cf. Talmudic Heb. mappa, contraction of menafa “a fluttering banner”))
a visual representation of an area—a symbolic depiction highlighting relationships between elements of that space such as objects, regions, and themes.  Many maps are static two-dimensional, geometrically accurate (or approximately accurate) representations of three-dimensional space, while others are dynamic or interactive, even three-dimensional. Although most commonly used to depict geography, maps may represent any space, real or imagined, without regard to context or scale [Wikipedia and Online Etymology Dictionary]

Continue reading

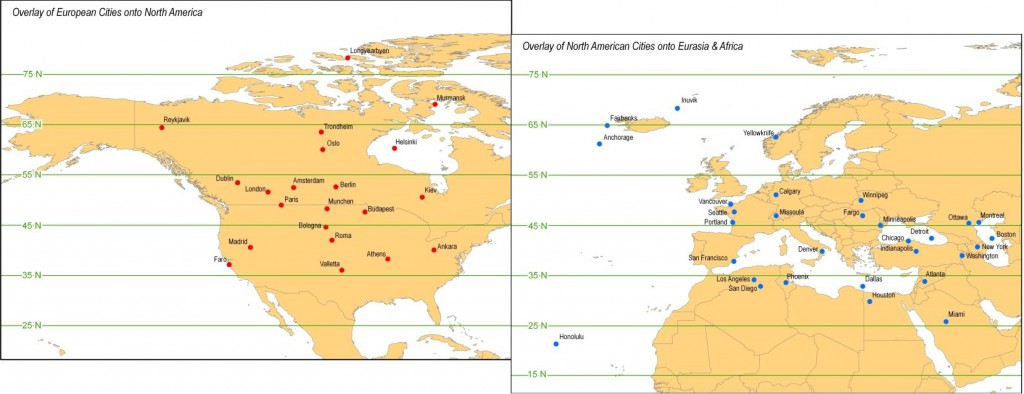
Overlay of European cities on North America (and vice versa)

I thought this was interesting — just in terms of how far north or south stuff is in the U.S. versus Europe.  Not what I would expect — Budapest is further north than the Twin Cities?  And actually, a good chunk of Europe is in Canada?  Some stuff is what you expect, though — the Mediterranean climate of California and the Napa Valley wine growing region, etc.

Transposition on maps of various kinds is an interesting idea…

WordPress: post-dating assignments

When I make a syllabus it makes general mention of all assignments (to help students with their own time management of assignments) but then I write up much more detailed assignment sheets for each project, which I have to then remember to xerox and hand out at the appropriate class.

Using WordPress as our backbone in 228 this semester, I decided that instead of making hard copies of assignment sheets, they would be posts (category: assignments) instead of hard copies (greener too).

Added bonus: since WordPress allows you to set the date and time for posting, David and I can actually write ALL of those posts in advance, setting them to go live at, say, 3:30pm on the day that the assignment is given. And then forget about it!

I’m terribly excited…

Categories vs. Tags — Support — WordPress.com

This seemed like a good way of thinking about the difference between categories and tags, so I ran with this:

Once upon a time, WordPress.com only provided a Category option.

Categories allowed for a broad grouping of post topics, but when you wanted to describe a post in more specific terms, more categories were required. That led to very long category lists inside the blog and very long lists in Categories Widgets.

So we now have tags, too.

Tags are similar to categories, but they are generally used to describe your post in more detail.

For example:

via Categories vs. Tags — Support — WordPress.com.