Map (1520s, shortening of M.E. mapemounde “map of the world” (late 14c.), from M.L. mappa mundi “map of the world,” first element from L. mappa “napkin, cloth” (on which maps were drawn), said by Quintilian to be of Punic origin (cf. Talmudic Heb. mappa, contraction of menafa “a fluttering banner”))
a visual representation of an area—a symbolic depiction highlighting relationships between elements of that space such as objects, regions, and themes. Many maps are static two-dimensional, geometrically accurate (or approximately accurate) representations of three-dimensional space, while others are dynamic or interactive, even three-dimensional. Although most commonly used to depict geography, maps may represent any space, real or imagined, without regard to context or scale [Wikipedia and Online Etymology Dictionary]
Cartography (in Greek chartis = map and graphein = write)
the study and practice of making maps (also can be called mapping). Combining science, aesthetics, and technique, cartography builds on the premise that reality can be modeled in ways that communicate spatial information effectively. [Wikipedia]
Chart (from M.Fr. charte “card, map,” from L.L. charta “paper, card, map”)
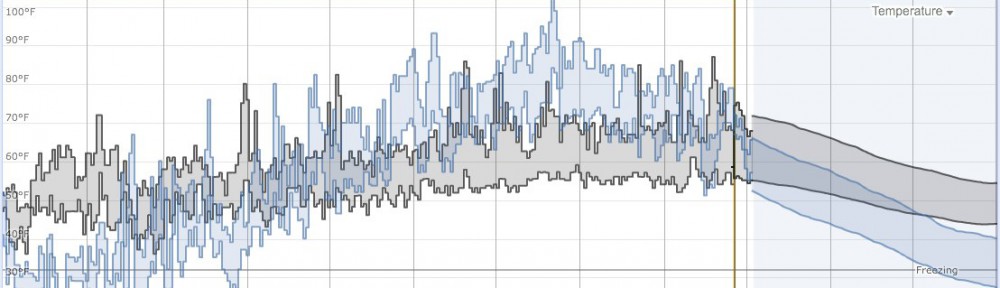
a graphical representation of data, in which “the data is represented by symbols, such as bars in a bar chart, lines in a line chart, or slices in a pie chart”.[1] A chart can represent tabular numeric data, functions or some kinds of qualitative structures. […] Charts are often used to ease understanding of large quantities of data and the relationships between parts of the data. [Wikipedia and Online Etymology Dictionary]
Graph (1875–80; short for graphic formula)
a diagram representing a system of connections or interrelations among two or more things by a number of distinctive dots, lines, bars, etc. […] A written symbol for an idea, a sound, or a linguistic expression. [from Dictionary.com]
Timeline (1951; time + line)
a graphical representation of a chronological sequence of events (past or future); a chronology. A schedule of activities; a timetable [from Wiktionary and Merriam-Webster]
Infographic (contraction of “information graphic”)
graphic visual representations of information, data or knowledge. These graphics present complex information quickly and clearly,[1] such as in signs, maps, journalism, technical writing, and education. With an information graphic, computer scientists, mathematicians, and statisticians develop and communicate concepts using a single symbol to process information. [from Wikipedia]