Here are the subway maps we’ve looked at in the last few classes:
-
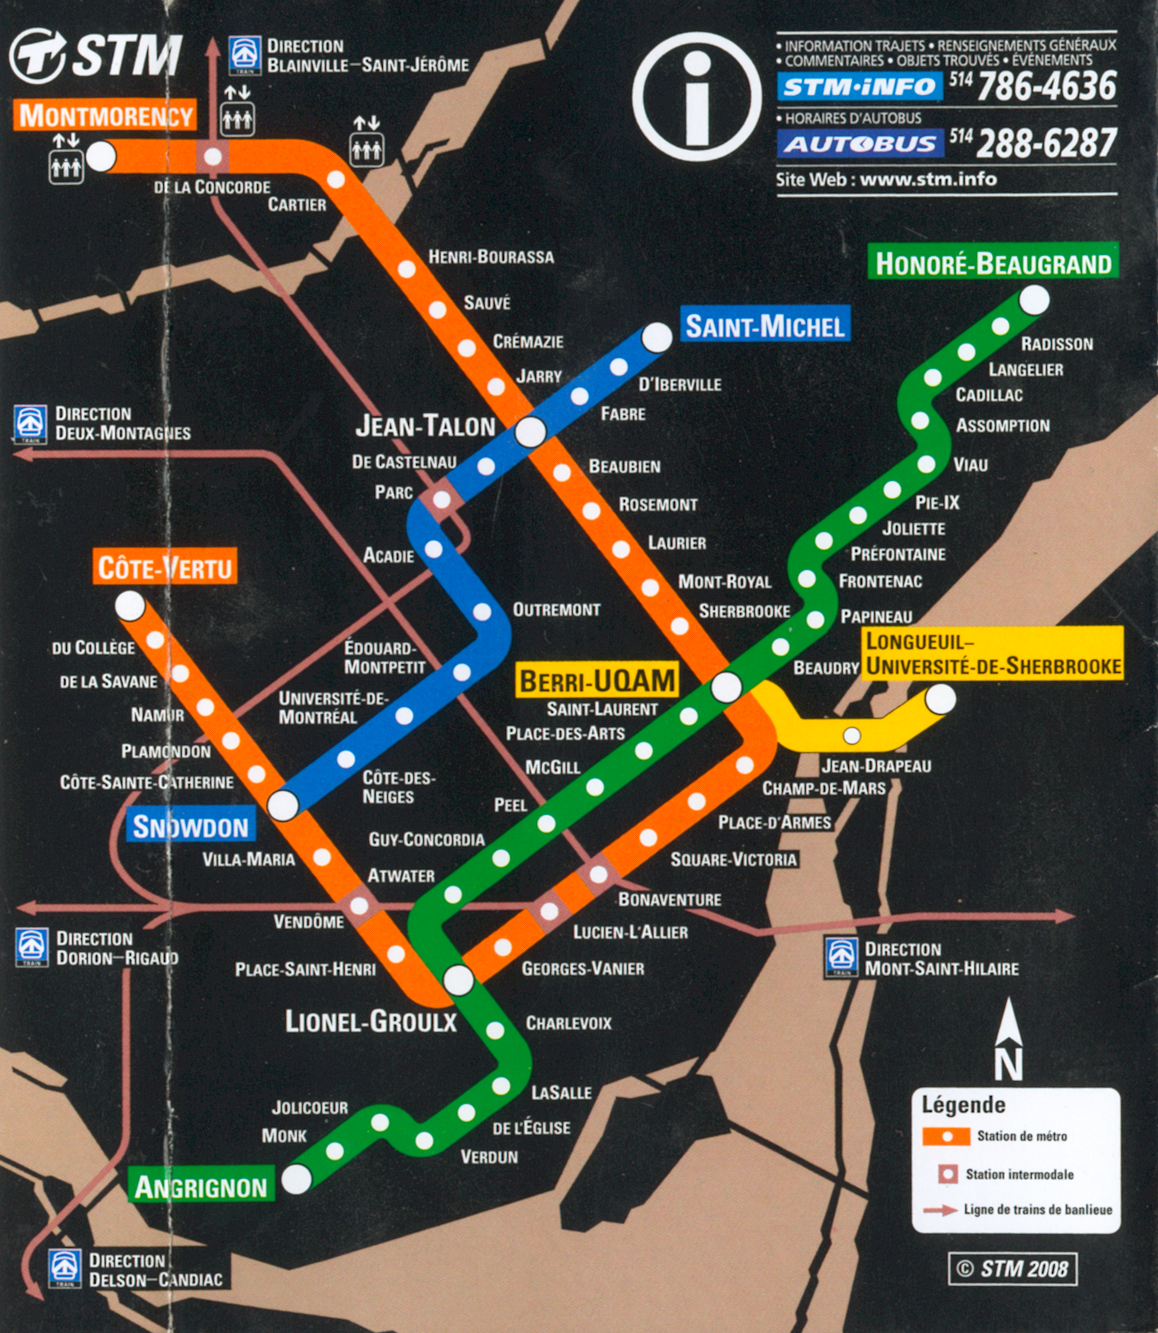
- Montreal Metro
-
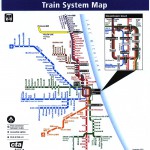
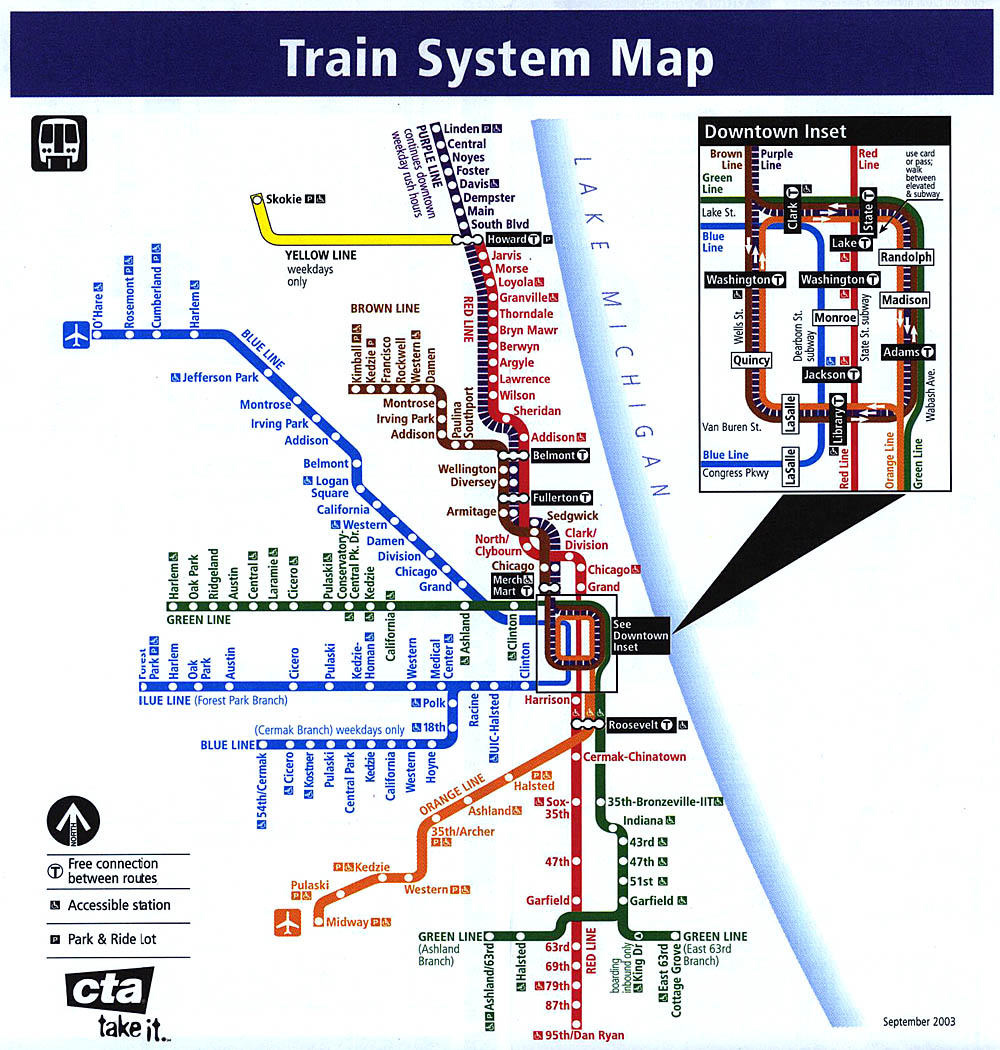
- Chicago El
-

- Paris Metro
-
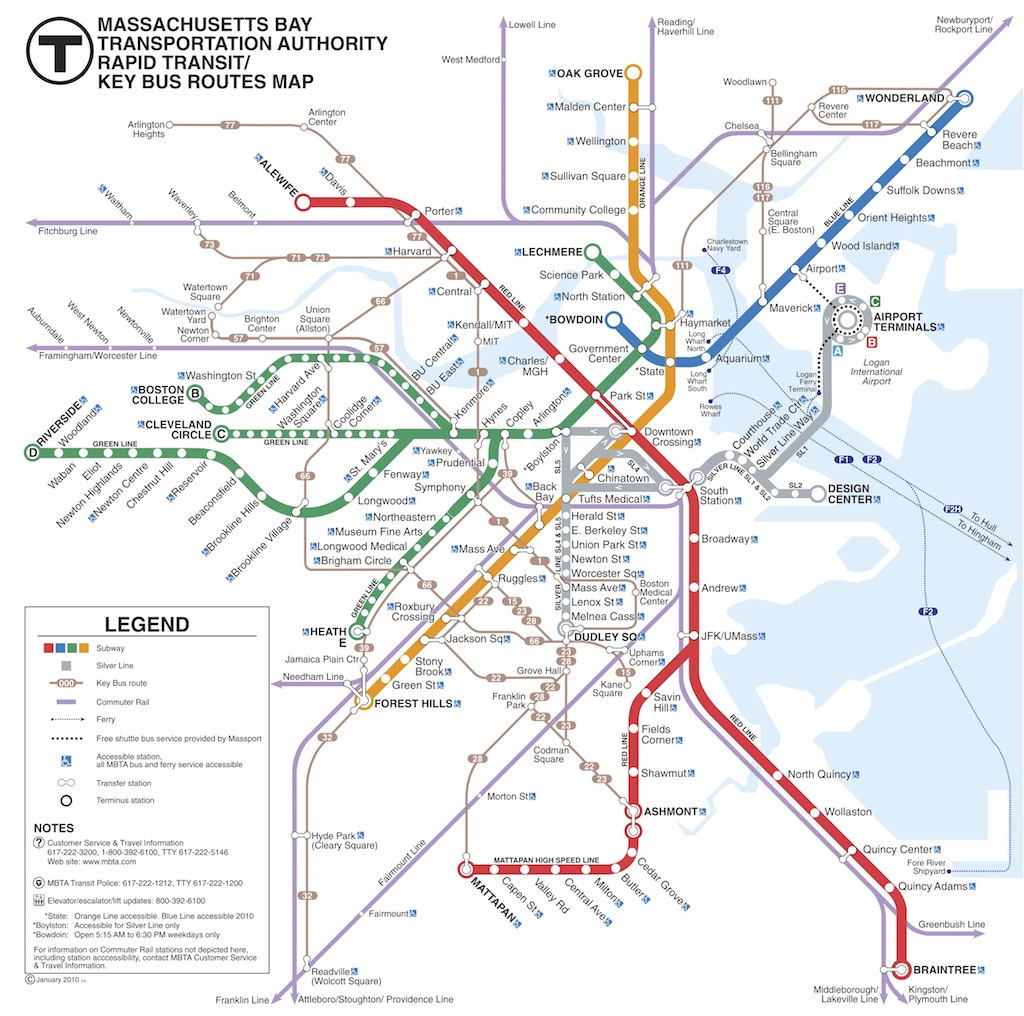
- Boston T
-
- London Tube
-
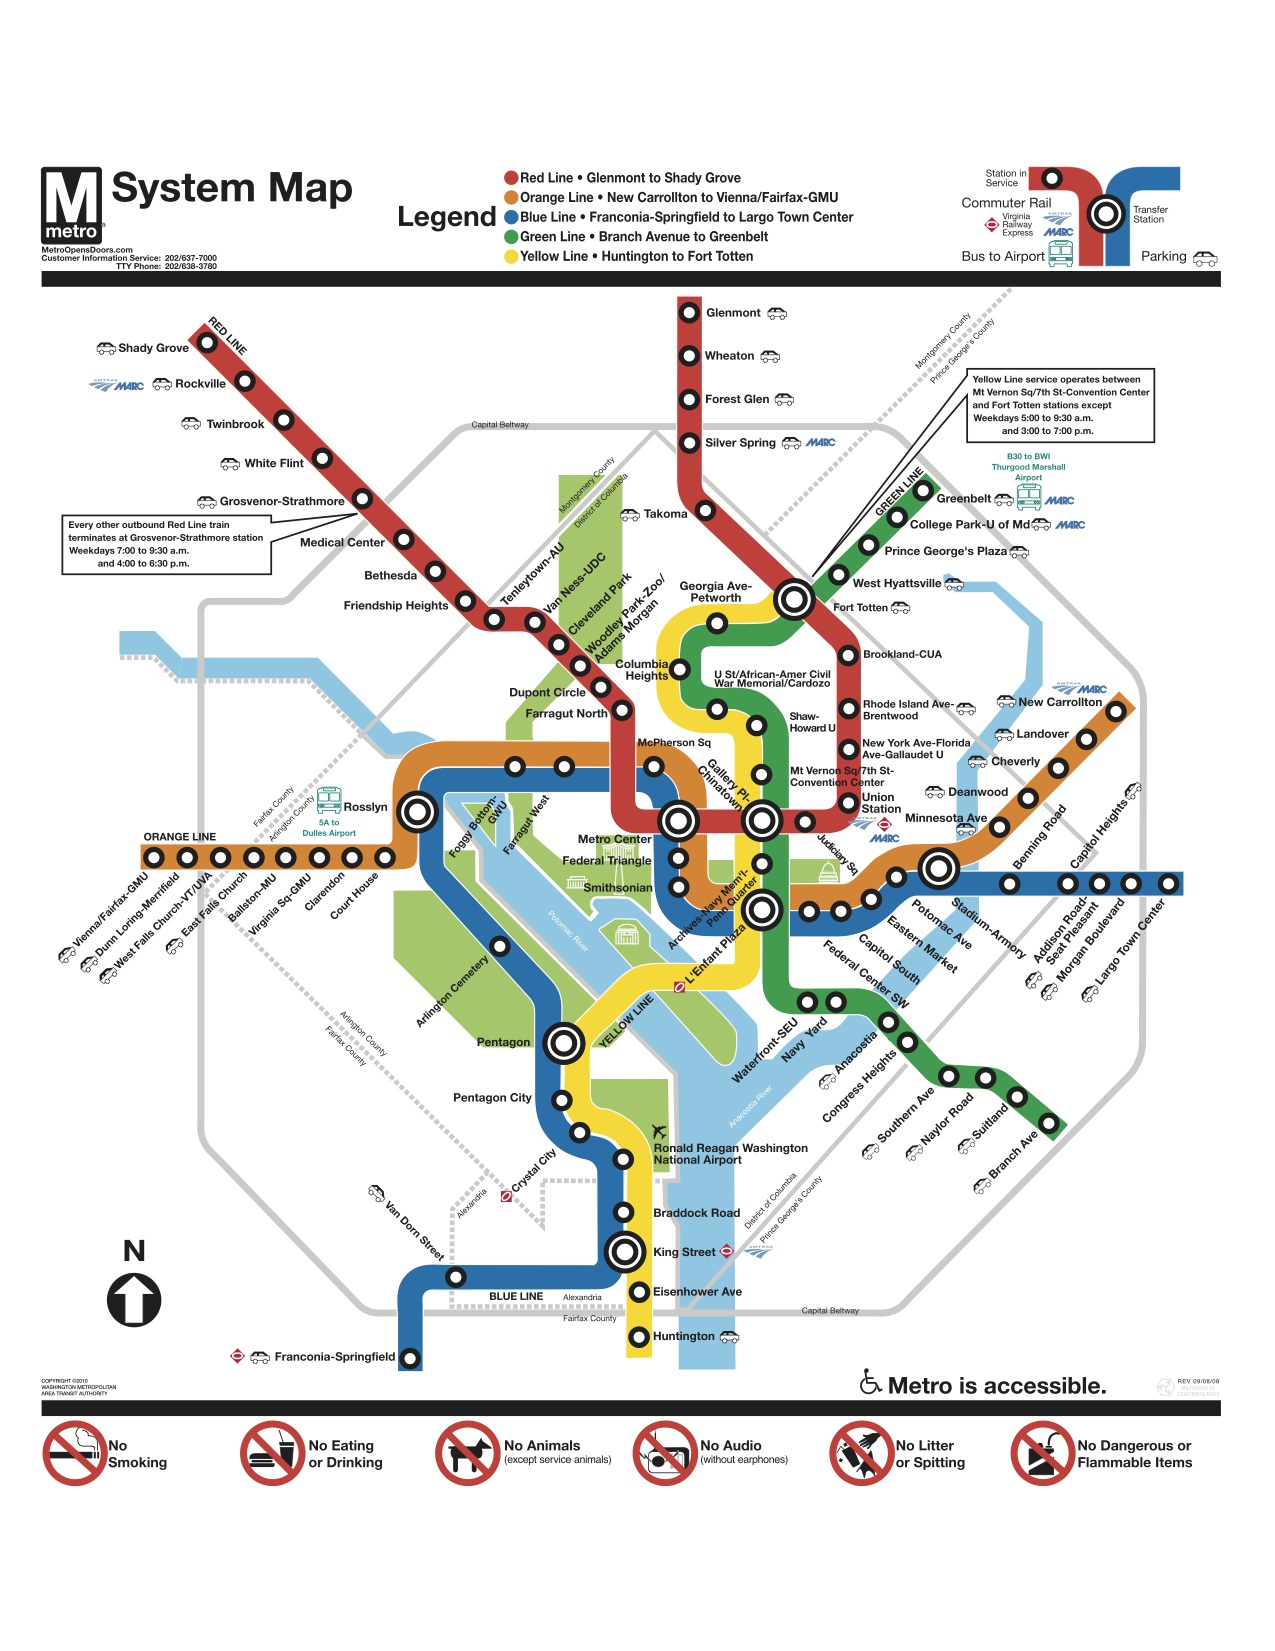
- Washington D.C. Metro
-
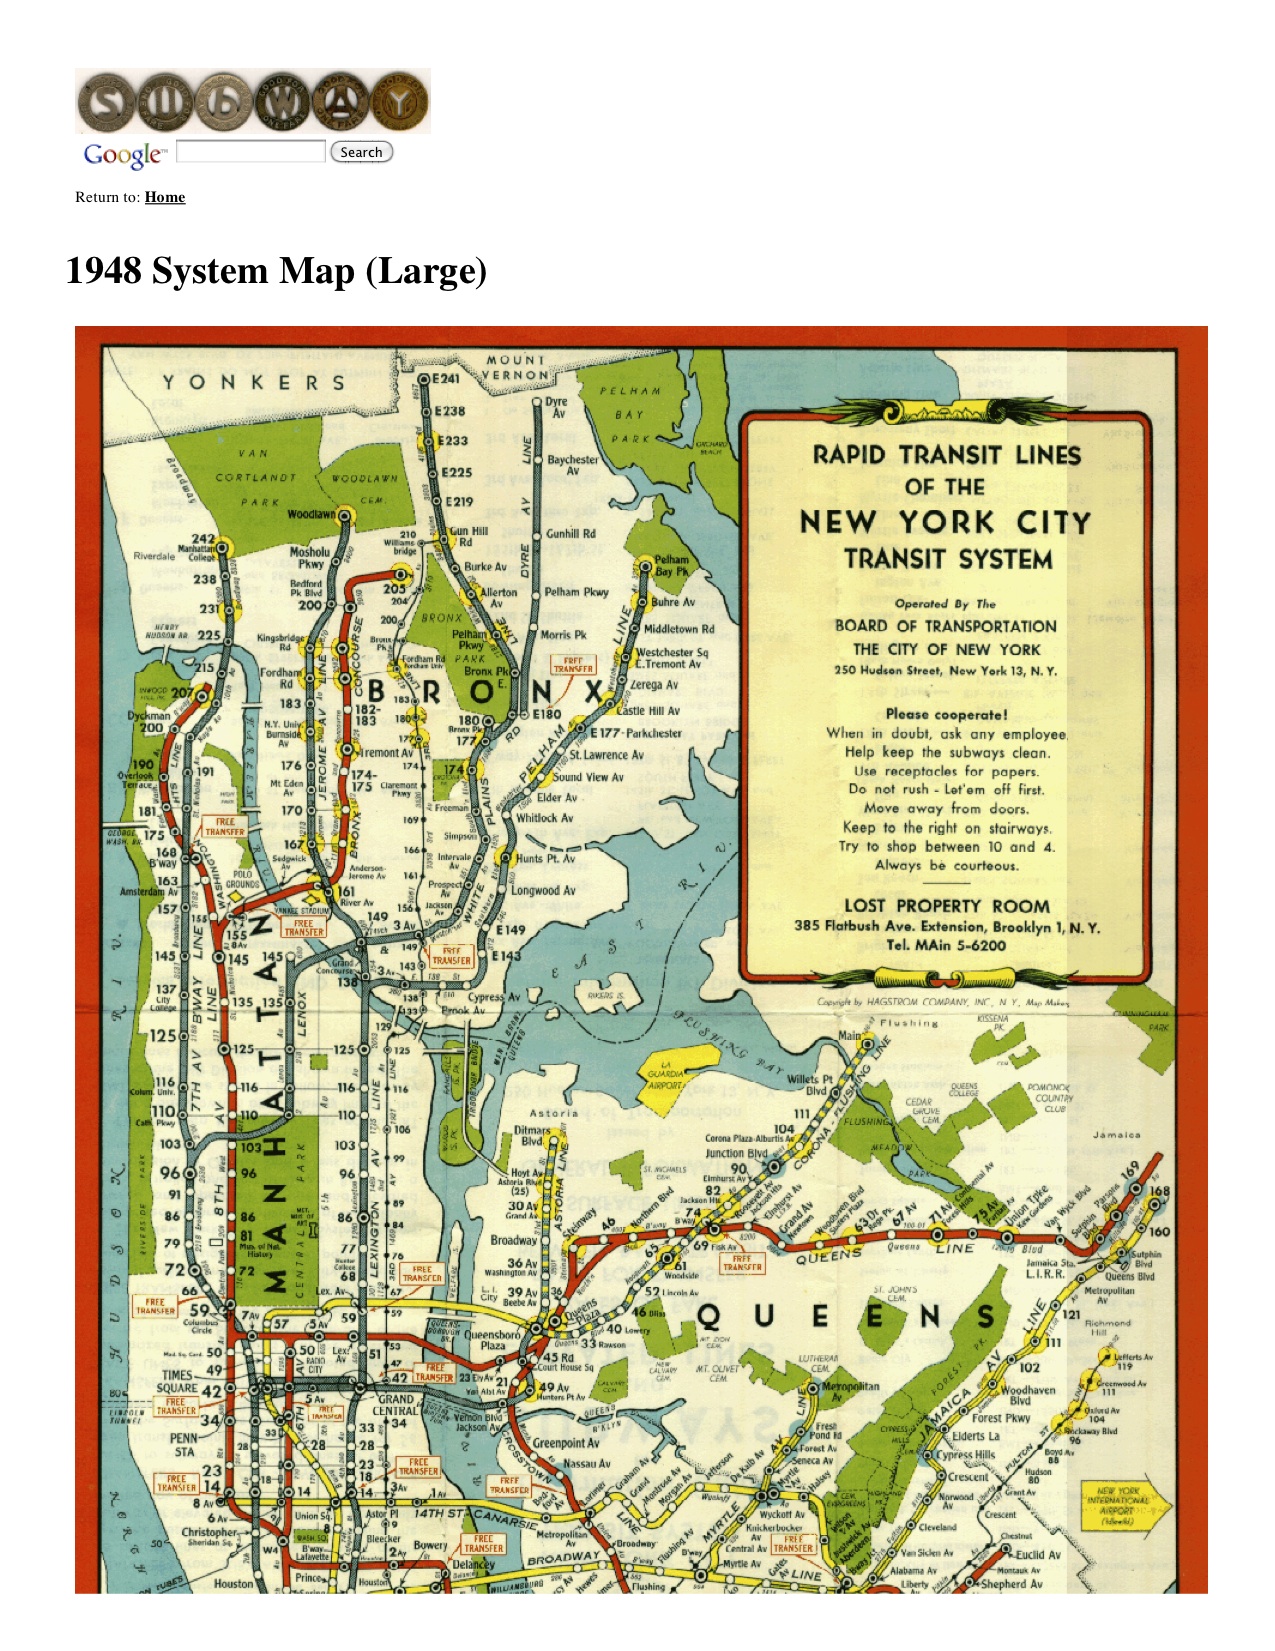
- NYC subway 1948
-
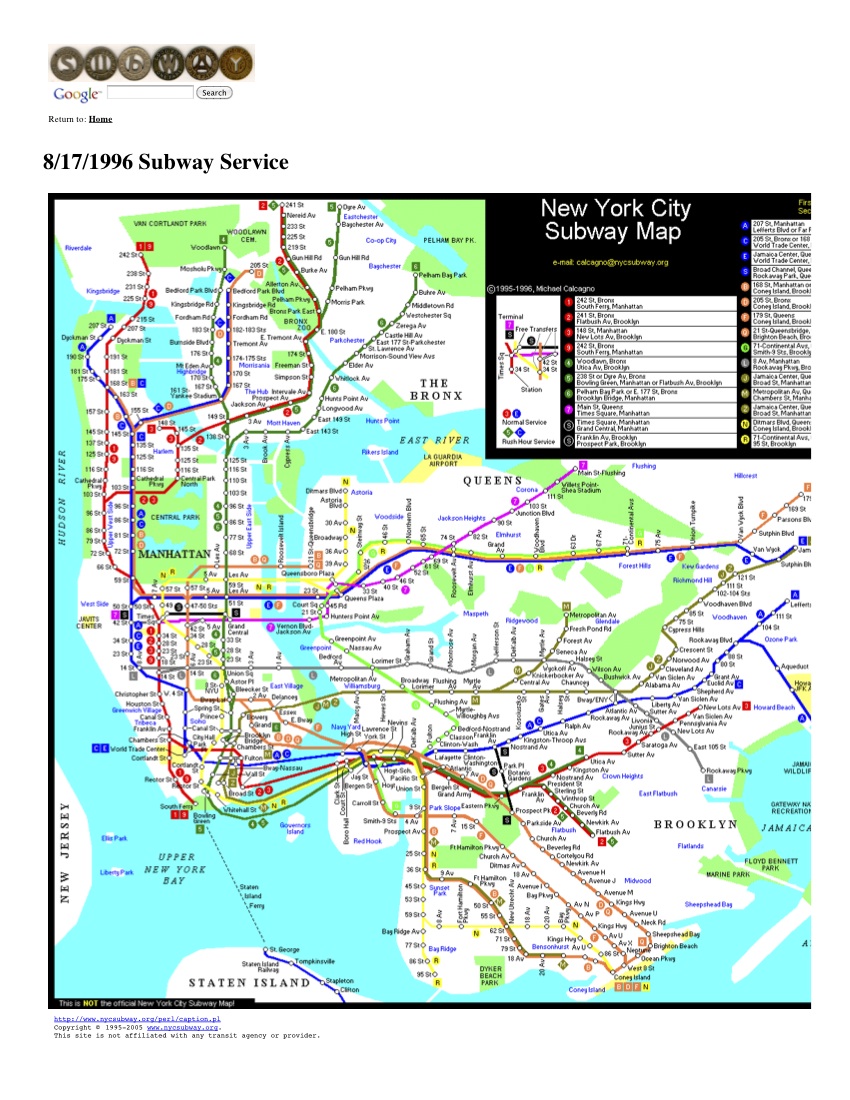
- NYC subway 1996
-
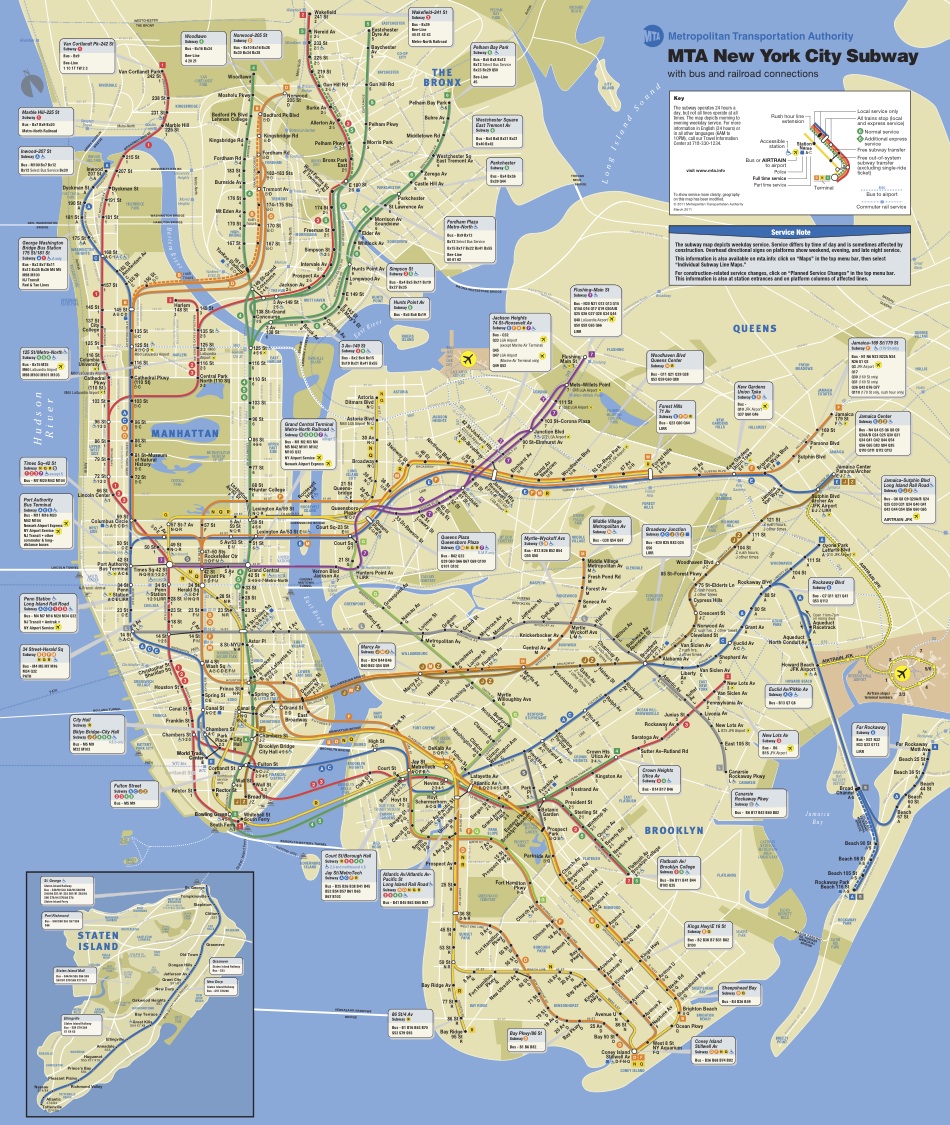
- NYC subway 2011
 Gerrymandering is an interesting use of maps to political ends. I remember reading about how computers have really changed this, allowing for much more precise (and ludicrous) redistricting in the last two censuses (2000 and 2010) that can target political maps on a per-household basis.