Revisiting Our 2019 Outlook

By Jack Brady

It’s been a pretty eventful 6 weeks since we published our initial outlook on 2019. Trade tensions have continued to ebb and flow, and the U.S. government shutdown ended uneventfully. The Fed has continued its “wait and see” approach to rate hikes, and as of Wednesday afternoon it looks like Powell may end the Fed’s balance sheet normalization at the end of 2019.

Since our 2019 outlook was always meant to be dynamic, we’re going to be revisiting a few of our “base case” assumptions about the global economy and the likely path of Fed policy that we posted back in January.

As a reminder, our three base case assumptions for 2019 were as follows:

1) Massive contraction in global liquidity.

 2) We’re late cycle.

 3) Powell is no Volcker.

 The assumption we’ll be revisiting in this post is the first, in which we assumed a steady balance sheet runoff on the part of the Fed, and no substantial easing on the part of global central banks. We’ll also be revisiting the likely impact of the Fed’s balance sheet runoff.

Our Updated View On Global Monetary Policy:

While we still don’t expect any substantial easing out of the major global central banks (we’re talking ECB and BoJ here — cuts from smaller banks such as the RBI aren’t particularly significant in our view), we are moderating our view on expected global tightening. After yesterday’s Fed minutes indicated that Powell intends to end balance sheet normalization this year, we see little reason to expect substantial tightening out of the Fed any time soon.  Just three months ago, Powell claimed that bond maturities were “on autopilot,” so this drastic capitulation on his tightening plans indicates to us that the Fed is likely going to be on hold for a while.

Remaining Balance Sheet Normalization Poses a Mere 1% Headwind to U.S. Equities: 

 We have also updated our views on the likely impact of the Fed’s balance sheet runoff this year. Initially, we had said that balance sheet normalization would be a major headwind to global markets in 2019, but we no longer believe that is the case.

According to the New York Fed, an additional $312.6 billion of Treasuries will roll off the Fed’s balance sheet by the end of 2019; so will an additional $5.5 billion of Fixed Rate Notes and an $600 million of Agency debt and TIPS. This brings total expected tightening for 2019, and for the foreseeable future, to $318 billion.

Using the so-called “shadow Federal Funds Rate” model developed by Wu & Xia at the Atlanta Fed, we have attempted to back out a reasonable value to assign to quantitative tightening, in terms of equivalent Federal Funds Rate hikes.

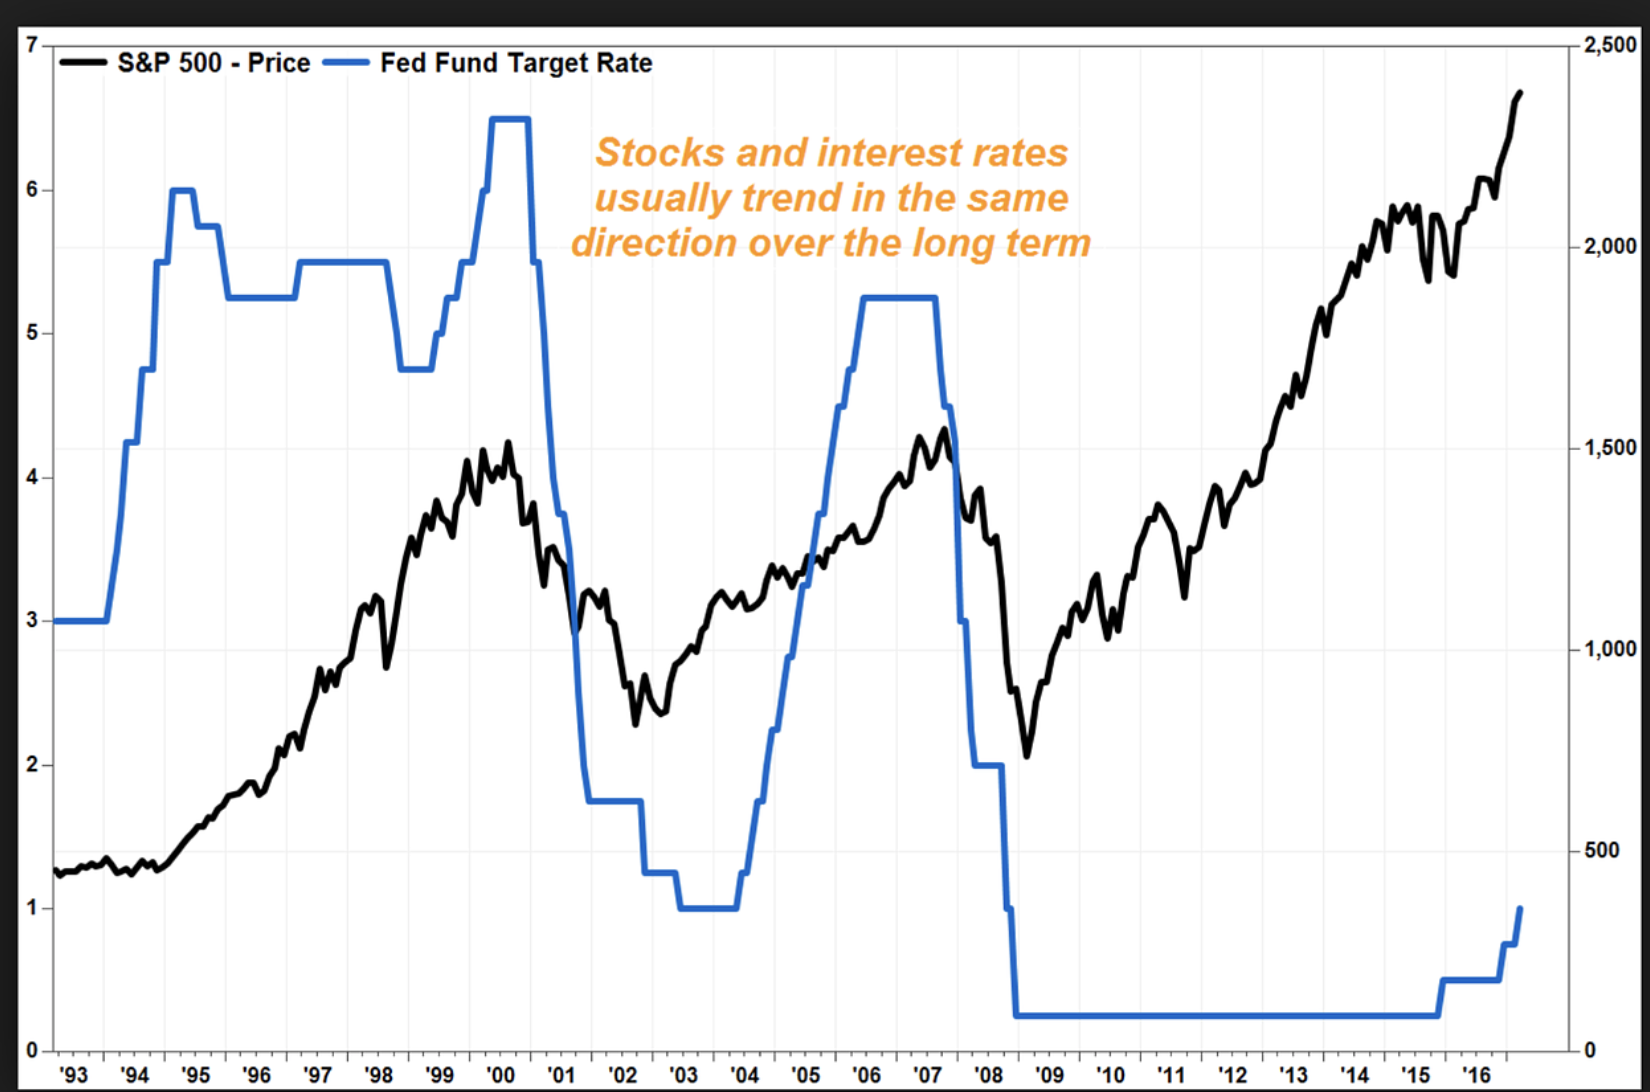
If we assume this model is correct, then the peak of the Fed’s $3.5 trillion Quantitative Easing program that ran from 2009 to late 2014 corresponded with a “shadow rate” of -3% (see below). With the Fed Funds rate pinned at zero that entire time, one can assume that $3.5 trillion of quantitative easing equated to roughly 12 rate cuts, so about $290 billion dollars of quantitative easing is needed to replicate the effect of one rate hike. Ignoring the fact that quantitative easing likely experiences diminishing marginal returns, we estimate that $290 billion of quantitative easing equates to approximately one rate cut, and vice versa.
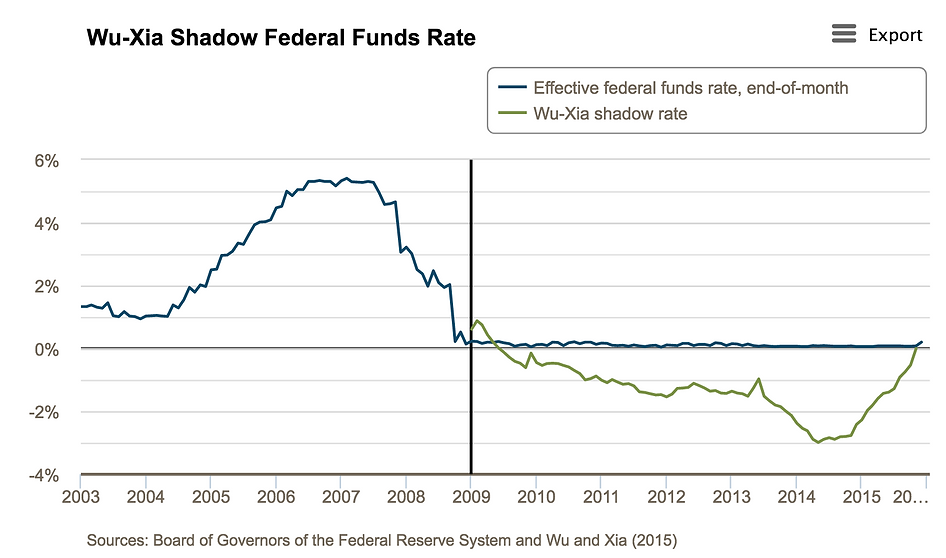
Note that the so-called “Shadow Rate” bottomed out at -3% in late 2014, coinciding with the peak of the Fed’s QE program. Source: Federal Reserve Bank of Atlanta

Note the Fed’s balance sheet peaked at roughly $4.4 Trillion in late 2014, rising from just under $900 billion pre-crisis on account of their ~$3.5 trillion QE campaign. Source: Board of Governors of the Federal Reserve System

Based on this simple estimate, the threat of the Fed’s balance sheet reduction is much smaller in size than we initially thought. The $318 billion of quantitative tightening that is scheduled for the rest of 2019 should equate to barely more than one rate hike.

Turning back to the path of risk assets, we can use the seminal 2004 paper by Kenneth Kuttner and Ben Bernanke to determine the likely impact of this quantitative tightening on the S&P500. Their paper, which analyzes the reaction function of the stock market to Federal Reserve policy changes, indicates that a 1/4 point cut in the Fed Funds rate generally correlates with a 1% rise in the S&P500. By this logic, the $312 billion in bonds rolling off of the Fed’s balance sheet over the next 10 months represent a headwind of little more than 1% to U.S. equity benchmarks.

The bottom line is that our fears regarding a “massive liquidity contraction” were likely overblown. However, our contention that the Fed is done with rate hikes for now and that the economy is very late-cycle remains in tact, as we have seen little evidence to the contrary over the past month and a half. Our moderated expectations regarding balance sheet normalization merely mean that this rally may have a bit more room to run than we originally thought.

How Does This Change Our View? 

At the end of the day, recent developments have only strengthened our conviction that it’s time to sell this rally, or at least to dial back equity exposure significantly. The Fed’s capitulation on rate hikes and balance sheet normalization, along with broadly soft global economic data, indicates to us that the Fed is done hiking for this cycle because they think they have finally broken something. We expect the mechanical rally in stocks to continue as interest rate expectations are revised downward, followed within a few months by a recession and substantial drawdown in global equities.

We’ll conclude with a chart that we pulled from our Macro piece published in December (please ignore the commentary on this graph for the purposes of this discussion). What this chart shows is that there is typically a knee-jerk rally in the stock market after the Fed ends a tightening regime, but that the weak economic fundamentals that cause the Fed to do so eventually win out after a few months. In our minds, this market remains a rally that you want to sell, in spite of weaker-than-anticipated headwinds from quantitative tightening.

Our Game Plan for Trading a Volatile 2019

By Jack Brady

Now that the dust has settled and we’re back at school, we here at Williams Insight are publishing our “gameplan,” so to speak, for trading a volatile 2019. Think of this as our macro-view, and how we plan to trade developments in financial markets.

The difficult part about publishing beginning-of-the-year pieces is that nobody gets it exactly right. Frankly, I’ve stopped reading anything where a financial commentator claims to know anything resembling the path of risk assets. That’s why we’re referring to our inaugural commentary of 2019 as a gameplan. As in the world of sports, the world of investing moves quickly and any good “coach” (portfolio manager) needs to be able to respond to changing and unpredictable conditions to correctly deploy their assets on the field.

This piece will have two sections. First, we will lay out our base-case assumptions for 2019. Most of these have been discussed at length in other articles, so we won’t get into the “why” of these assumptions so much as the “what”.

Second, we will lay out how we plan on trading various developments that could materialize this year, based on our assumptions about the macroeconomy. Let’s get started!

2019 Base Case:

1) Massive contraction in global liquidity. This has been a favorite topic of mine, and has been discussed at length in several different articles. Suffice it to say that global financial tightening is now in full effect, and it will take nothing short of a recession to stop it. I believe this will be the key theme of 2019, in the same way it was the key theme of 2018. It’s no coincidence, in my view, that December was one of the worst months of stock performance since the Great Recession (depending on which index you track). Once the ECB stopped QE, liquidity simply began to vanish from markets.

2) We’re late cycle. Central banks are tightening, equity markets are volatile, valuations (and possible even earnings) have peaked for the cycle, most economic indicators have either peaked or are at cycle highs, and interest rates have been rising for about two and a half years with few pauses. It doesn’t take a rocket scientist to realize this cycle (which was artificially prolonged by CB liquidity which — you guessed it — is getting pulled back) is getting long in the tooth.

3) Powell is no Volcker. As we’ve seen over the past three months, Powell’s claims that he would ignore political pressure and signals from the stock market were… well they were overstated. We expect balance sheet tightening to continue, but we (like the Federal Funds Futures market) don’t have a strong view on the path of rate hikes, as they’re likely to be data dependent. Relatively easier or tighter policy from the Fed will certainly have the power to bend the edges of this cycle a bit (I’m talking months here, not years), which makes them important to consider. That being said, the writing is on the walls in the form of $50B a month in balance sheet reductions from the Fed.

What To Do About It.

So we’re late cycle. But that leaves the question of what to do about it. It is often observed that the tail end of bull markets experience the most ferocious rise in asset prices, so there’s definitely an argument to be made that one should maintain a reasonable amount equity exposure. On top of that, equities seem to be temporarily bottoming as we speak, so selling everything now might not be the best bet.

Our mantra for 2019 is simple: hold on to what you have for now, and selectively sell rallies. As we’ve pointed out before, late-cycle dynamics often create volatility to the upside, as well as to the downside. That is why we advocate lightening up on high-beta exposure when the market does happen to exhibit strength. When I say high-beta, I’m referring to volatile, economically sensitive positions that have been doing very well during this bull market and are likely to get creamed in the event of a recession. For example, I am looking to get out of my position in QQQ (Nasdaq ETF) at a reasonable level.

What constitutes a reasonable level is tricky, but we have a few helpful tips in mind.

1) Define your “target” exposure levels for the end of the year, and work towards that goal. For example, I hope to own only my core, longer term positions by the time the year is out, and park the rest in Robin Hood where I earn 3% risk free. These core positions include SDY (Dividend Aristocrat ETF), VWO (Emerging Markets ETF), and my 2-10 steepener position (shorter term, but still one of my core positions as of early December). Everything else is up for sale at the right price. Certainly this is more art than science, but here are some useful levels:

2) Begin sizing out of positions quickly if the S&P hits overbought territory (RSI over 70). This is not likely in my view, but a move up as violent as this would certainly provide an exceptional opportunity to sell.

3) Begin sizing out of positions quickly if the S&P approaches 2018 highs. Roughly 2900.

4) The tricky part is knowing when to sell if markets don’t exhibit a late-cycle mini boom. This is why it would be prudent to sell off a little bit of equities every time the S&P has a “notable” day or two. A rough metric for measuring this would be that you should sell every day Bloomberg or the Wall Street Journal has a headline about how well the markets are doing.

5) Develop your own view, and modify your portfolio accordingly. We’re better sellers right now because our bias is to be short the market. If you think that the recent correction was overblown, then buy the dip — after all differences of opinion are what makes a market! Just make sure to set up your own “guidelines” for when to sell or when to buy more.

Finally, a note on buying the dip. Since we’re on the bearish side, we’re not looking to fade 5% moves down in the S&P because we think the biggest moves in 2019 will be down. We’re currently selling our equities, collecting 3% interest on cash, and waiting for the “big dip” (Full Disclosure: this may not happen in 2019). Our “big dip” needs to check three boxes:

1) Markets fall at least 35% from their peak. Recessions (look at the last 2) typically entail a 50% drawdown, peak to trough (although how long this takes varies from several months to years). Whatever comes next will be following an unprecedented rally in equities, so it could actually be more than that 50% figure. Regardless, a dip of less than 35% is likely to be ephemeral.

2) The yield curve should steepen like crazy during the big dip as shorter term rates collapse relative to longer term yields. This is characteristic of a recessionary bear market, and will coincide with any big, career-making dip-buying opportunities.

3) People will be terrified. Even though this is totally subjective, it’s a useful metric nonetheless. The next “big dip” will almost certainly coincide with policymakers scrambling to figure out what to do, pundits declaring an inevitable “lost decade” of stock market returns in the 2020s, and President Trump going far crazier than normal. If Trump punches Powell on national TV, you have our blessing to lever up and go long.