DUE: Thursday Oct 13
Assignment: Storytime Performance
Reply
DUE: Thursday Oct 13
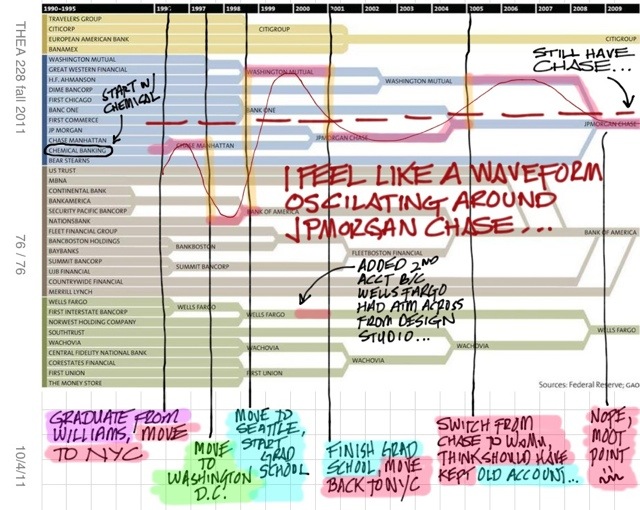
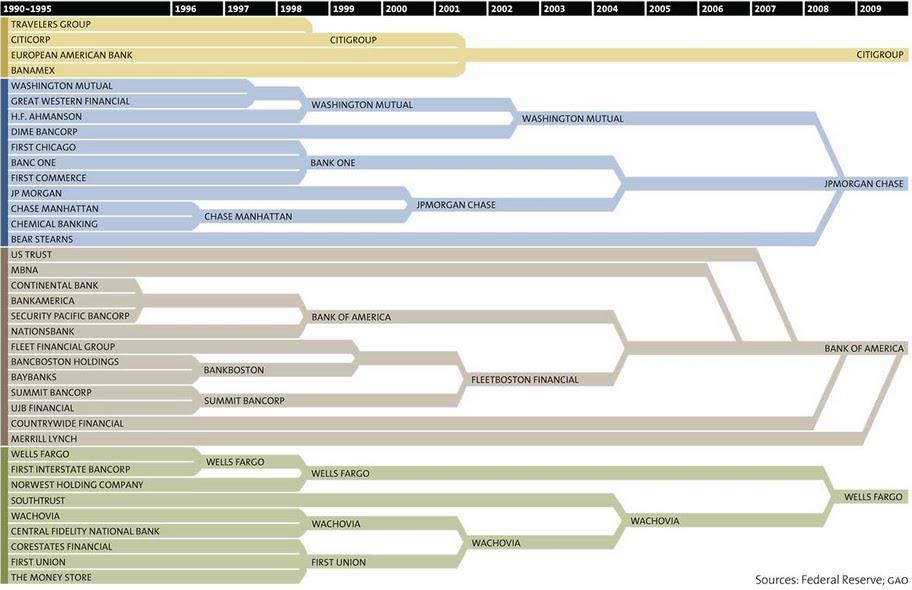
My own history with the expansion and consolidation of banks. The lesson I have learned: Chase is The Borg, resistance is futile, and you (or your bank) will be assimilated.
 Whoa. Kind of puts it all in perspective.
So I’m here at the Gaudino talk, wishing all if you were here as well! Anyway, we must get Satyan Devadoss to come talk with us, not only because his area of study is topology (which we got a glimpse into with Julia.s paper and presentation today) but also because he, too, is obsessed with the visual display of information, and makes these beautiful drawings of strange four-dimensional objects folded through 5-dimensional space with flexible sides and other things that make my brain hurt. And he is fascinated with the idea of bringing art and mathematics together in such a way that both lead to greater understanding and discoveries in their own fields through the exploration of the other. As he says (and he and I have had this conversation previously as well), most of the time with artists and mathematicians come together, the mathematicians end of making bad art, and the artists end up presenting math that is 300 years old and thinking it’s new and cutting edge.
As we go along in class, I’m finding things that people are doing where I think, “Oh, we should have gone over this or that app, or other way to do things, or had some app that I didn’t think of before!” So here I’m accumulating those thoughts for future use.
For everyone in the class, if any of the things I mention ring true, and you would like us to take some class time to go over them, let me know in comments. If you’ve already figured out another way of accomplishing the same goal, please share.
DUE Thursday Oct 6
I have added a page to the site with online resources for map (and Map) related stuff — cartography and infographics blogs, map archives and the like. If you have any favorite resources that you would like to have added, send me the URL and a brief description of what you like about the site, and I’ll add it to the list.
You can find the link in the menu bar, or go there directly.
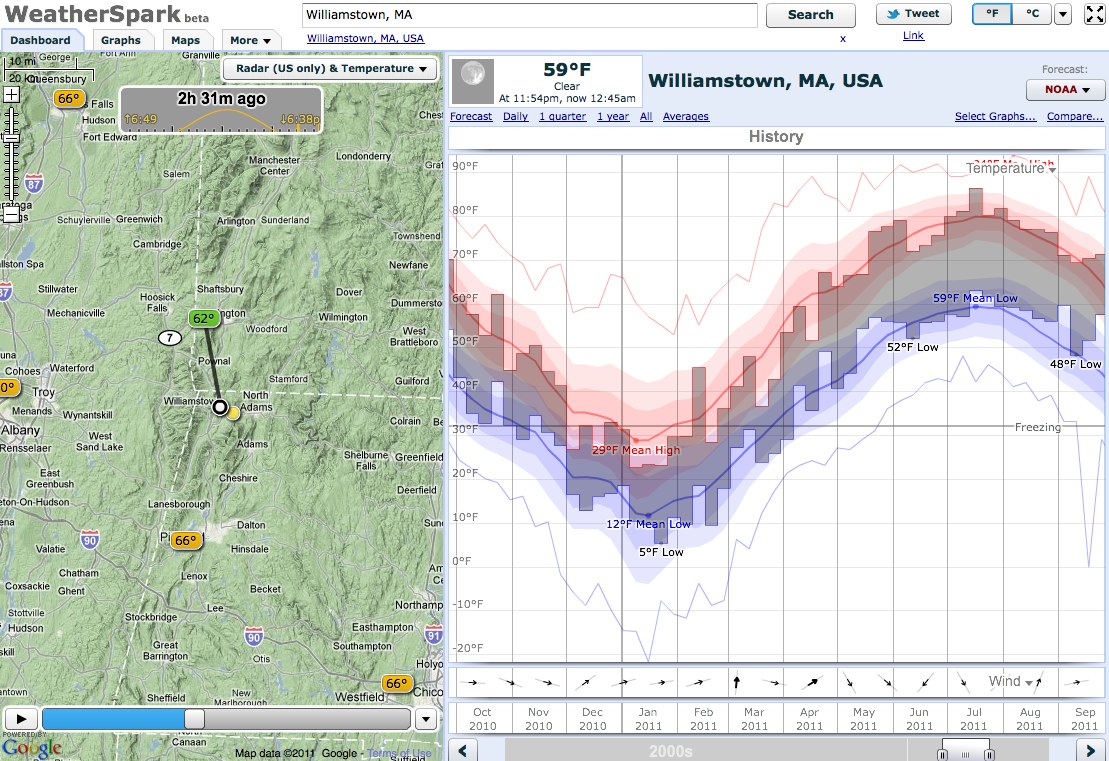 WeatherSpark is an excellent weather data visualization tool, including radar map video, temperature histories, forecast, daily averages, historical trends, and comparative weather charts…And very attractively presented.
Here’s the WeatherSpark map of Williamstown.

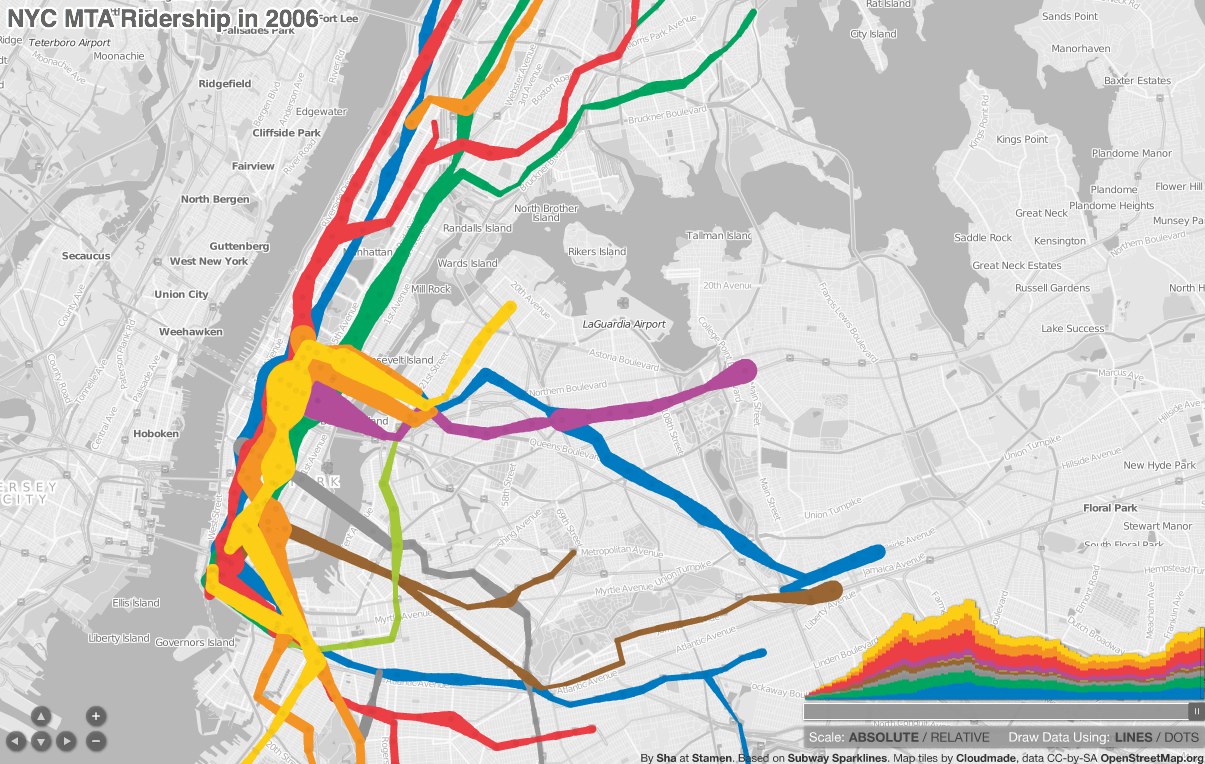 A pretty amazing map-cum-timeline of subway ridership from 1905 to 2006, displays with either lines or dots, and allows you to scrub forward and back in time. Also check out his original blog post about making the map, and the underlying data that he got from the blog frumination (which is also pretty great, the blog of a grad student in transportation and operations research.)
DUE Thursday Sept 29