Blooming For Energy Storage: Why Bloom Energy Could Be Interesting

By Nathan Szeto

In the middle of the Nevada desert stands a 195m tower surrounded by an army of shiny, flat objects in a scene not entirely unlike something one would find in a sci-fi novel. This structure, however, serves a much more mundane, albeit necessary, purpose – the storage of energy.

This structure is called a “concentrating solar power” plant. It works like this: the plethora of mirrors surrounding the tower direct solar rays to the top, where a vat of molten salt sits to absorb the heat energy that can eventually be utilized as electricity. It’s been said that this energy storage method “has the most promise for energy generation and storage from solar power.” Just think about that for a moment though. A tower with special salt is one of our best options for renewable energy storage. Plus, it’s not like the whole world is covered in deserts that are waiting around for us to build salt towers on them.So what other options do we have?

Let me introduce to you solid oxide fuel cells. They promise to produce and store electricity for months after said electricity was produced. What’s more, they need only hydrogen as an input and when run in reverse as an electrolyzer produces hydrogen. In other words, solar and wind energy can be used as inputs to produce hydrogen, which can then be used to produce electricity. For more details on how they work, refer to the above diagram.

These new types of fuel cells are currently produced by only one company – Bloom Energy (NYSE: BE). If they can deliver on their promise of clean, long-lasting energy storage, the implications for the feasibility of renewable energies as our primary – if not only – energy source are massive.

The primary existing energy storage method, lithium batteries, of course has its strengths. It is relatively long-lasting and high in terms of energy density, for example. However, lithium is itself a very troublesome resource in that it is itself a non renewable resource and mining it is extremely water intensive. To illustrate this last point, I ask you to consider the fact that in a given year lithium mining consumes a full 65% of Chile’s entire water supply, which is simply ridiculous.

The batteries themselves are not without issues either. One minor (actual major) one is that they are prone to exploding if they are not carefully monitored. Usually this problem isn’t significant for smaller applications like electric vehicles (EVs) where software is capable of carefully monitoring the battery’s health and status. But in large energy storage plants that contain thousands of lithium batteries there are bound to be accidents. Also, I would be remiss in not reminding you of the notorious tendency of lithium batteries to lose capacity over time. And last of all, lithium batteries are simply too expensive.

Consider California, which produces more than 8 million megawatt-hours (MW) of surplus energy during the summer and yet can only store 150000 MW of it. Why? Because buying the lithium batteries necessary to store it all would cost a grand total of $2.5 trillion. Again, that’s simply ridiculous.

Now let’s return to Bloom. In addition to its innovative solid oxide fuel cells, the company already has a massive presence in developing countries like India that will inevitably consume increasingly large amounts of energy per capita as their economies continue to grow. However, the US also promises to become a huge factor in Bloom’s further growth.

With the election of President  Biden and a Democratic congress, the likelihood of a substantial, perhaps even once-in- a-lifetime, environmental aid package has skyrocketed. Biden has already made it  abundantly clear that he intends to pass such a package. Such a package will undoubtedly include provisions for increased spending on renewable energy implementation. It really doesn’t take a genius to figure out how Bloom might benefit of such a plan were passed.

So why do I believe that the market hasn’t already priced this possibility into Bloom’s stock price? In short, I don’t. Rather, I believe that because of the uncertainty surrounding the final details of an environmental package and whether it could pass at all, the current stock price still has potential to rise if said package should pass congress.

So why do I believe that an enormous environmental package will definitely pass congress? In short, I don’t. Rather, I believe that even if said package never comes to fruition, the inevitable march towards greater renewable energy adoption continues will present opportunities to Bloom regardless. Such adoption is not only morally justified, but also economically. It is now a fact that fossil fuels cost more per unit of energy produced than renewable energies.

Lastly, I would like to take a quick look at Bloom’s financials, more specifically its EBITDA values.

Based on EBITDA values projected by the S&P’s Capital IQ financial database, I was able to project future EV/EBITDA values with 10X, 15X, and 30X multiples. Using these EV/EBITDA values I project that with conservative 10X and 15X multiples we might be able to expect -61.94% and -36.76% equity upsides, respectively. However, the potential upside seen in the numbers along with the broader trends in politics and society might make this investment nonetheless attractive for certain investor profiles. In short, Bloom Energy (NYSE: BE) presents an interesting, perhaps underestimated opportunity for investment.

Fox: Tune Into Profits

By David Shakirov

Fox Corporation (NYSE:FOXA)

Fox Broadcasting Company - Wikipedia

Market Cap EV P/E Net Income Mgn Net Debt/EBITDA Proj. Upside (2024)
$17.6B $21.5B 11x 13% 1.1x +119%

Fox Corp is a media conglomerate operating in two main segments, TV and Cable.. The TV segment has local stations covering <40% of the US population, the Fox channel, and digital operations like Tubi, Fox.com, Fox Nation SVOD, Fox Soul AVOD, etc. The Cable segment has Fox News, Fox Sports, Fox Business, FoxNews.com, etc. Both the Cable and TV segments are monetized by “affiliate revenues” (i.e. subscription $ from providers) and “ad revenue”. The misc. segment includes a fin-tech called Credible, an animation studio Bento, and Fox Studios.

The company’s core assets — the Fox channel, Fox local news, Fox News, Fox Sports, and Fox Business — are high quality, durable crown jewels generating steady cash flows. Its other tech-focused assets like Tubi and Credible are grossly undervalued by the public markets. This memo will split Fox Corp’s business into five segments and value each by piece.

Fox’s channels are considered to be the most valuable asset of a cable or broadcast bundle, exemplified by the propensity of cable companies to eat up Fox’s affiliate fee hikes of ~10%/year. Fox’s digital strategy – across the online radio, web, social media, and Fox Nation – develops online engagement. Finally, Fox can capture the upside as users move from traditional TV to free ad-supported on-demand content, especially as advertisers pay to target Tubi’s young users, ~90% of whom cannot be reached via trad. cable.  Interestingly, Fox has a stake in fintech Credible, sports betting through Flutter/FanDuel, livestreaming via Caffeine + a $1.5B tax shield

Broadcast Television

Projected 2024 EBITDA $884mm
EV/EBITDA Multiple 6x
EV of Segment $5.3B

This segment includes the Fox channel, which is the most-watched broadcast station, with ratings 31% higher than the #2. Fox Corp also owns 29 local news channels (11 are duopolies) covering 40% of the US, where the local news industry has grown at 4% CAGR since 2015. Importantly, roughly 80% of its content across this segment is viewed “live” 90% of the time (e.g. news, sports, etc.), not O.D. However, this is the least compelling segment as it’s not a premium offering with margins <10%.

Tubi

Projected 2024 Revenue $351mm
EV/Revenue Multiple 6x
EV of Segment $2.1B

Tubi is an extremely interesting opportunity for Fox. Tubi provides an on-demand platform of free-to-watch content supported by ads (aka “AVOD”). AVOD is very important in the streaming world as it provides a free on-demand streaming option for younger audiences, 81% of which want to accept ads for free content (especially as Netflix/Hulu keep hiking prices). This digital-streaming solution is highly prized by Wall St. since it represents the post-cable future. Comps trade at ~6x revenues and roughly $20-30 valuation/user. Given Fox already has a vast collection of content, it can “recycle” it for free on Tubi and generate valuable digital ad revenues (targeted digital ads are worth much more than OTT-broadcast TV ads). Tubi grew +100% last year and now has close to 40m registered users. Very importantly, 87% of Tubi’s users cannot be reached by cable advertising, so they are a highly valuable user base. Fox bought Tubi in early 2020 for $450m, after selling its stake in Roku for a $300m profit. Tubi’s revenues are expected to surpass Fox’s primetime broadcast-ad revenues (which I estimate to be close to $400m). I estimate Tubi’s valuation as of 01/21 to be ~$700m (so, 2x long-term revenue vs. 6x+ comp.). The long-run value and potential of the AVOD business is exciting, yet not baked in the market value of Fox.

Cable Television

Projected 2024 EBITDA $2.7B
EV/EBITDA Multiple 12x
EV of Segment $32.8B

Fox News, Fox Business, and Fox Sports are premium offerings available through cable subscriptions + supplemental online content, podcasts, radio, digital, etc.. Controversy and political bias aside, Fox News is the highest rated cable TV channel and Fox Business has higher ratings comparable to CNBC. Both are watched by relatively affluent audiences (better ad dollars). FoxNews.com is a digital leader with 11x as many impression-minutes as ABC.com, 7x CBS.com, 6x NBC.com, and 2x NYtimes.com. Its supplemental subscription digital offering, “Fox Nation”, has a loyal base with a 80%+ convert from free trial to paying subscriber. Overall, this is a premium, high-quality, durable segment which operates at ~50% EBITDA margins and warrants at least a 12x multiple.

Credible

Projected 2024 Revenue $220m
EV/Revenue Multiple 5x
EV of Segment (67% stake) $737m

Fox acquired 67% of Credible for $265m in 10/19. Credible is an online financial technology company offering loan comparison tools. Previously, Credible was publicly traded. The revenues doubled from 03/19 to 03/20, and now likely crossed $100m in annual run-rate revenue. Credible has some synergies with Fox Business, and was fast-growing before the Fox relationship. On its own, Credible is disruptive, and successful, but the specific synergies between the two businesses are unclear.

Other
Fox a few other interesting features:

  • 3% ownership in Flutter and an option to acquire up to 18.5% of FanDuel
    • Synergy between increasingly legalized sports betting market and Fox Sports
    • Stake currently worth ~ $400m (but poised for growth as sports betting expands)
  • Full ownership of Bento, which is a well-respected animation studio (behind Bob’s Burgers, Central Park, etc.)
  • Full ownership of Fox Studio Lot
  • Minority ownership of Caffeine, a social-media live-streaming start-up ($600m valuation)
  • $1.5B tax shield post-C21 separation

Model and Valuation Summary

PayPal: Power to the PayPal

By Caroline Orphanos

PayPal Holdings Inc. (NASDAQ: PYPL) 

Market cap: $274.41B

P/E Ratio: 88.45


Company Description  

PayPal Holdings Inc. operates as a technology platform and digital payments company that enables digital and mobile payments on behalf of consumers and merchants worldwide. Its payment solutions include PayPal, PayPal Credit, Braintree, Venmo, Xoom, and iZettle products. The company’s payments platform allows consumers to send and receive payments, withdraw funds to their bank accounts, and hold balances in their PayPal accounts in various currencies. It also offers gateway services that enable merchants to accept payment online with credit or debit cards as well as digital wallets. Founded in 1998 and headquartered in San Jose, CA. 


Investment Catalysts

PayPal has done a great job showing how a top notch fintech firm can take advantage of the changes brought by the COVID-19 crisis, face the challenge of a disruptive economy, and come out on top. COVID has accelerated the rise of digital payments with many physical retailers closed and more and more consumers shopping from the comfort of their homes. As stores have reopened, touch free payments are sought after due to concerns with handling physical cash, and inertia will likely keep these gains in place for the years to come. Of those in the digital payment sector, PayPal in particular has experienced astounding growth and boasts strong financials: 15.2 Million Net New Active Accounts were added in Q320 alone, the strongest quarter in company history despite the major recession and economic turmoil in the broader economy and market.


Total Payment Volume (TPV) growth was impressive as well: 4 Billion payment transactions and $247B TPV in Q320, up 30%, with Venmo alone processing $44B in TPV (up 61% from Q2). GAAP EPS up 121% to $0.86 in Q320, and a share buyback of 1.8 million shares returning $350 Million to shareholders projects confidence of management in the future of the company.


PayPal also recently introduced their Venmo credit card issued by Synchrony (NYSE: SYF) and powered by Visa network, stepping into the credit card game after the success of the Venmo credit card and capitalizing on Venmo’s steady young user base and shows a partnership with competitor Visa. This is part of PayPal’s efforts to diversify Venmo’s monetization, having grown from relying solely on merchant fees on websites and mobile apps for revenue to moving further into the physical retail space as well. The Venmo Credit Card and Debit Card both feature a custom QR code that allows easy peer-to-peer payment and tap to pay functionality, building on Venmo’s social aspect with the option for users to share transaction activity to their Venmo feeds if they wish. The company also announced a partnership with CVS (NYSE: CVS) in which they pledged support for QR code PayPal and Venmo transactions in 8,200 of its stores in the US by the end of 2020. Additionally, Venmo charges fees for certain account transactions such as instant cash withdrawals and peer-to-peer payments made using a credit card account.


PayPal’s business model contains broad exposure and diversification in the digital payment world. PayPal provides its flagship gateway platform with a mostly older user base, and fast-growing Venmo offers a large young user base and social media like aspect that generates strong loyalty and network externalities. The company also has strong opportunities for further growth. Internationally, Venmo is US only right now, with great potential to expand to other markets abroad. PayPal has also been making bold moves in the crypto world, as in late 2020 they rolled out their new service enabling users to buy hold and sell crypto directly and make it available as a funding source at its 26 million merchants worldwide. The feature has seen strong early demand and drove a spike in downloads of the PayPal app on Apple’s App store.


Competition

PayPal is part of a crowded industry, with strong competition from Square (CashApp), Zelle, Apple’s Apple Pay, traditional credit card companies such as Visa and Mastercard, and recent addition Google’s Google Pay. The digital payment industry experienced solid growth in the 2010s that is projected to continue in the coming years, with an expected CAGR of 13.5% for 2020-2025.


  PYPL SQ V MA
Revenue growth from 2019 19.15% 76.72% -4.92% -4.18%
EBITDA growth from 2019 23.76% -60.51% -4.35% -2.02%
P/E ratio 86.71 0.0 43.41 52.67
EV/EBITDA        
Market share        
Net profit margin 15.48% 4.05% 49.74% 43.13%


Analysts recently have been buzzing about the addition of Google Pay to the playing field. On the surface Google Pay could pose a challenge to PayPal, considering the influence of Google and its integration with popular Android technology. However, I believe PayPal and Venmo are poised well to hold Google at bay, due to both the solidity of PayPal’s success and Google Pay’s lack of a strong foothold in the fintech sector so far. Google Pay currently serves about 150 million users, less than half of PayPal’s 361 million active accounts. However, many of those payments likely originate from the Google Play store where Google Pay is the default option for all Android users. Google Pay isn’t in even the top 10 of Apple’s App Store finance app rankings as of late December, while Square’s Cash App, PayPal’s Mobile Cash, and Venmo are all in the top five. Additionally, according to McKinsey’s 2019 Digital Payments Survey Google Pay isn’t one of the top three methods for in-app payments, online payments, or peer-to-peer payments. Only in in-store payments did Google Pay gain a significant foothold where it still is far away from Apple Pay, and which are not part of PayPal and Venmo’s main business model.    


Lululemon Update: Fitness that Fits Your Portfolio

By Sarah Ryu

Lululemon Athletica Inc (NASDAQ:LULU) 


Summary  

Lululemon Athletica Inc (“Lululemon”) is a technical athletic apparel brand that offers a variety of products, from fitness clothing and accessories to yoga classes. Despite its competition against larger wholesalers and sportswear companies, Lululemon has built its image as a “lifestyle” brand and a loyal consumer base by personally connecting with customers through ambassador programs and free yoga classes. With 515 stores in 17 countries worldwide, the brand’s continuous international expansion, especially in China and Europe, has led international sales to grow 45% in revenue just last quarter. Lululemon generates $4.07 billion in revenue and has a market capitalization of approximately $45.36 billion. 


Thesis  

As of December 31st 2020, Lululemon is trading at $350.78 per share, up 51.41% on the year. Due to Covid-19, the sportswear market faced a big drop in sales in physical stores, yet Lululemon fared relatively better than its competitors like Nike. Compared to the third quarter of fiscal 2019, net revenue rose 22%, primarily due to its shift to e-commerce. While comparable store sales decreased 17%, direct to consumer (DTC) revenue increased 94% (accounting for 42.8% of total revenue at the end of Q3). Lockdowns and work from home (WFH) culture have favored this segment of the retail market, proving to be the silver lining during the pandemic. As more competitors enter this market with the surge in athleisure consumption,  Lululemon looks toward innovation and various expansion opportunities to differentiate itself.


Opportunities

While Lululemon’s revenue is highly concentrated in the United States and Canada, comprising 68.5% and 16.0% of total revenue, respectively, revenues outside of North America represent 15.5% of total revenue. Though the brand is still in the early stages of international expansion, it is on track to executing its five-year growth plan of quadrupling international revenue ($1.44B by 2023). Recent Q3 results show that international revenue grew 44.6% (at a 5 year CAGR of 38.0%). On a broader scale, the global sportswear market reached $181B in revenue in 2019 and is expected to reach $208B by 2025, indicating a continued traction in this market. The brand is eyeing China and Europe as their next key drivers in revenue in the coming years, and just during fiscal 2020, Lululemon has opened eight new stores in China (515 stores open as of November 2020). 


In addition, Lululemon has implemented several initiatives to be at the forefront of product expansion and innovation. On July 7, 2020, the company acquired Mirror, an interactive fitness platform featuring live and on-demand classes, for $500M. As the brand continues to integrate Mirror within its ecosystem, Mirror is expected to generate $150M in revenue in fiscal 2020. By 2023, Mirror could expect to reach 600,000 subscribers and $700M in revenue.. The booming growth of this interactive fitness market is expected to grow at a 32.6% CAGR and is a hopeful indicator that Mirror also becomes a promising channel of potential returns. Competitors like Peloton, whose revenue grew to 232% year over year in the previous quarter, greatly benefited from the pandemic and surge in at-home fitness demands. 


Lululemon’s expansion of sizes and men’s products have also strengthened its business amid the pandemic. Offering more sizes played a role in the increase of 22% in sales of women’s clothes last quarter, as the brand was able to attract a broader set of customers. Revenue from men’s apparel rose 38% in the last quarter, and the brand’s goal is to double the size of men’s revenues by 2023. Just last year, men’s products made up 21% of Lululemon’s sales. As WFH continues and demand for athleisure rises, Lululemon’s acceleration of the men’s division will help the brand achieve its goal. Lululemon is also looking to step into the footwear market and launch its first collection in early 2022, increasing revenue streams in the long-run.  


Financials 


Lululemon’s current EV/EBITDA = 37.8x


Company EV/EBITDA
Nike 37.4x
Adidas 28.1x
Gap 6.3x
Under Armour 35.6x
Puma 31.8x
Nordstrom 24.7x
Peloton 184.8
Median 27.3x 


2020 (LTM) 2021E

+14%

2022E

+14%

2023 E

+14%

2024 E

+12%

2025 E

+10%

Revenue 4.07B 4.67B 5.29B 5.98B 6.70B 7.37B


+ $450m for revenue of non-growth-pillar related business lines.

= $7820 total 2025 estimated revenues

@25.5% EBITDA margin (up from 23% in 2020)

= $1.99B EBITDA

@ 27x EV/EBITDA

=$54B EV

= $52B market cap

= $400/share  [~30% further upside]


Risks and Competitors 

As Lululemon is in a large, fast-growing market, it will be increasingly difficult to defend its market share against competitors like Nike, Athleta by Gap, Target, and others. Many of these new entrants are already market leaders in the retail space and their scale allows them to quickly go to market and leverage their large customer base. A month ago, even Kohl’s announced that they would be starting a new brand to compete in the athleisure market.

Such brands have the greater advantage of having longer operating histories, broader supply chains, extensive customer bases, and greater brand recognition. This is a significant risk for Lululemon, as it aims to increase the number of worldwide stores and quadruple international revenues. If customers in countries like Europe and China prefer to purchase domestic brands or the large apparel companies, it would prove more difficult to overcome the long presence and reputation of those sellers. 


Along with the ongoing impact of Covid-19, the acquisition of Mirror has incurred significant costs for the brand and may limit its operating flexibility, if the potential benefits and returns are not fully realized. Not only does the brand need to attract and maintain subscribers to MIRROR, but it must also provide engaging classes, innovative technology, and assurance of data privacy in order to grow the business and level of subscriptions. If such expectations aren’t reached, Lululemon may run the risk of failing to reach the level of profitability. With other in-home fitness platforms, like Peloton and Tonal, Lululemon will have to find ways for Mirror to differentiate itself as a brand and its services.  


Internally, Lululemon should be wary of losing their brand identity as it launches many products and services too quickly. While being a brand for everyone can serve a wider audience, this may not sit well with the existing customer base, especially for a company that has built its brand on high-end utility wear. Gap had similarly failed in efforts and has taken steps back, cutting newer product lines and focusing on customer needs. By attempting to appeal to customers of all ages, races, and sizes in the early 2000s, the brand had lost its steam and identity, being called too “basic” to consumer’s tastes. 


Conclusion

My overall recommendation is to buy Lululemon. Lululemon’s resilience during the pandemic and striking e-commerce sales has put the company in a better position than its competitors that faced greater losses. Total revenue significantly rose 22% year over year in the fiscal third quarter, compared to the mere 2% in the previous quarter. The potential profitability of the recent acquisition of Mirror and increase in revenue streams (international and menswear) will allow the brand to increase its dominance in the market share. In an industry growing at a CAGR of 5.1% with a positive outlook for athleisure demand, these long-term growth and expansion opportunities make the stock an attractive buy. 


https://www.fool.com/investing/2019/05/02/lululemon-growth-plan-double-quadruple-sales.aspx

https://investor.lululemon.com/news-releases/news-release-details/lululemon-unveils-power-three-strategic-plan-accelerate-growth#:~:text=The%20Company%20plans%20to%20fuel,and%20to%20quadruple%20international%20revenues.

Kroger: Shop for Their Shares

By Nico Cavalluzzi

Overview

Kroger’s successful physical stores and ventures into online shopping present a twofold profit mechanism that have not only helped it succeed during COVID, but have expanded and innovated on its revenue streams for the future. Though Kroger continues to face tough competition from both big-box competitors and gourmet grocers, as well as questionable growth in the hypercompetitive delivery space, it mitigates these risks with infrastructure developments and key acquisitions that its competitors are not doing. Assuming a P/E multiple of 15x and an EPS of $3.00, conservative increases from current values of 12x and $2.75, respectively, investors can expect a share price target for Kroger of $45, a 40% premium.


Company Description

The Kroger Group (KR), founded in 1883, is a Cincinnati, Ohio based retail company. KR operates supermarkets, pharmacies, jewelry stores, petroleum stations, and multi-level department stores through one of its many subsidiaries throughout 35 US states and the District of Columbia. KR has over 400,000 employees and over 2,700 individual stores, making it one of the largest employers in America.


Company and Industry

KR is the United States’ largest supermarket by revenue, with $121.16 billion of revenue for fiscal year 2019, and the second-largest general retailer in the country, only behind Walmart (NYSE: WMT). KR, like Walmart and many of its other peer competitors, offers customer loyalty programs, online ordering and contactless delivery of its grocery and retail products. 

The grocery space today is generally occupied by three types of retailers: gourmet groceries, local supermarkets, and big-box hypermarkets. KR, for instance, mainly operates in the big-box space, but also owns various regional supermarkets and groceries. Throughout the United States, grocery sales in general have been up 29.3% since March 2019, largely due to COVID-19 pandemic restrictions on restaurant operations and quarantine mandates, limiting consumer’s food options.

  1. Company Comparables as of January, 2021
Company EV EV/EBITDA EPS P/E
Walmart (WMT) 456B 11.4x $5.68 21.0x
Costco (COST) 156B 18.5x $10.24 37.1x
Dollar Tree (DLTR) 34B 7.3x $6.07 26.6x
Sprouts (SFM) 4B 5.4x $1.82 9.9x
Kroger (KR) 44B 5.8x $2.75 12x

Source: Koyfin, Public Filings


Investment Catalysts

KR’s low EV/EBITDA and P/E multiples compared to industry competitors, indicating a cheaper valuation, yet consistently even performance with competitors in terms of store growth and online presence indicate that KR has the legs and space for growth until its multiples better align with competitors. Interestingly, despite a recent flurry of acquisitions and partnership, analysts have not yet priced this into KR, mainly due to uncertainties from the COVID pandemic. That said, these acquisitions pose KR well for competition in the retail space, which is increasingly becoming automated/online. First, KR made news when it acquired ClusterTruck, one of the first ghost kitchens. Ghost kitchens deliver meals to customer’s doorstep without the physical footprint of a restaurant. ClusterTruck has locations throughout the midwest, further building into KR’s dominance in the region. Additionally, KR entered into an exclusive partnership with Orcado, which focuses on direct to consumer delivery of groceries and household goods

In addition, KR analysts have raised expectations for sales and profits forecasts for 2021, largely fueled by increased home-cooking during COVID-19 extending throughout the coming year. Earnings are also forecasted to rise as online infrastructure and supply chain near completion. Increasing ventures into retail space, which require low capital expenditure, open new revenue streams, even considering competitors occupying the space currently. Assuming that KR’s acquisitions go smoothly, and they are indeed able to improve in quality, we can assume a conservative growth in profits and valuation.


  1. KR – 1 Year

  1. KR – 3 Year

As of January 21, 2021, provided by the TD Ameritrade


Key Highlights

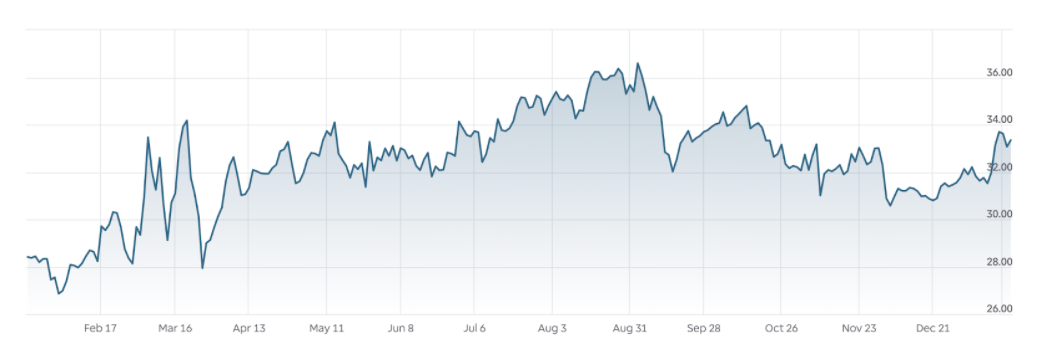
When looking at Chart II, it seems that the largest impact of COVID-19 (typical consensus is mid-March 2020) caused a significant drop in KR stock price. However, using some further analysis we can see from Chart III that while a pullback was noticeable, KR both recovered quickly and continued growing beyond its previous 3 Year high. KR was smart in navigating the pandemic.  Its ability to bounce back and take advantage of increased at home cooking can be seen in its ability to lessen the impact of economic uncertainties in the market. Returning our attention to Chart II, we can see a dip beginning in September 2020 after a strong run to $36. This dip can be accounted for by announcements of vaccines and a general loosening of restrictions in many states, especially midwestern states where KR operates and which had looser restrictions throughout the pandemic anyways. 

Though it may seem that we are too late and will miss out on any COVID-related upside, recent discussions of a “second wave” and the Biden administration’s likely strong stance on enforcing quarantines means that restaurant operations will be limited for a least the next few quarters, again which can be seen by KR’s rise end of Q4 2020. Stepping back, this insight is also important because it speaks to a potential stickiness of KR in society post-COVID. While people may eventually go out 1-2 times more a week than during quarantine, where they weren’t going out at all, their positive experiences at KR stores and online means that the consumer base will either stay at pre-COVID levels or increase. As can be seen in Chart III, KR was rising Q4 2019, which we can extrapolate to a post-COVID society in 2021.


Risks

As mentioned previously, KR’s biggest short-term risk is a restaurant recapture of lost market-share and KR’s investments lacking a targetable market. With restaurants returning, it feels that trips to the grocery are slowing down. Has KR lost its momentum just when it needs it most? After all, KR lacks a strong differentiator from either its big-box competitors or local and regional high-end stores. From one end, KR is squeezed by restaurants and delivery apps like DoorDash. Consumers feel less inclined to run the supermarket for a meal they need to cook, and more inclined to press a button on their phone for already prepared food. From the other end, KR doesn’t have the global reach like a Walmart, nor the cultural influence like a Whole Foods.

Second, and possibly even more concerning, is that even if KR has market access and a differentiated product, it still has a long way to go before it fully develops the delivery infrastructure for both its online shopping and direct to consumer services. Against established online competitors like Walmart and Amazon Fresh, and even some meal kit services like BlueApron and HelloFresh, time may be the one thing KR can’t afford to waste.

Importantly, KR is trying to mitigate these risks in both the short and long term. First, KR is partnering heavily with Google’s Cloud AI software, which it hopes to use to improve the search functionality on its website for consumers looking to order groceries and consumables online. Additionally, KR’s recent investment in Mirakl, an e-marketplace for B2B and B2C retail, seems to be a keystone in its plan to rapidly bring its ambitious delivery goals to scale.


Conclusion

KR presents an interesting play for investors looking for blue-chip stocks that not only have traditionally strong dividends and stability, but are actively seeking new avenues of growth and acquiring innovative companies to achieve their goals despite instabilities and competition in the market.  It does this in two ways. First, KR is setting itself up well for a competitive post-COVID 19 economy, where retail especially will most likely be geared toward online and contactless delivery and pickup. Undoubtedly, the distribution of a vaccine will lead to celebration from consumers, many of which will be eager to leave their homes and spend more time than usual going out to shop. In this scenario, KR is positioned to take advantage of its traditionally strong store presence. That said, many consumers will continue to be wary to shop in highly concentrated areas, and will continue to choose delivery. Even more so, consumers may find the speed of delivery and pickup to outweigh the experience of shopping in person, and will choose them out of convenience rather than fear. In these scenarios, KR’s investments in ClusterTruck and Orcado help KR compete with both restaurants and online groceries. These investments als allow KR to test recipes, food preparation and advertising methods, crucial consumer data it can then apply to its physical stores.

Second, KR has anchored its place at or near the top of the retail industry for the future not due to a shift in corporate values, but thanks to its flurry of acquisitions and partnerships with software and technology companies. Partnerships with Google Cloud AI and Mirakl, for example, will enable KR to quickly and effectively compete with established players in the online retail space. Overall, investors should expect steady or modest returns through the rest of 2021, with the potential for exponential growth once KR finishes developing its infrastructure of modern delivery services. Assuming a P/E multiple of 15x and an EPS of $3.00, conservative increases from 12x and $2.75, respectively, expect a share price target of $45.


KR is trading at $33.21 (+0.42%) as of close Thursday, January 21, 2020

Presented by Nico Cavalluzzi for Williams Insight

Sources

https://finance.yahoo.com/news/kroger-upgrades-2020-sales-profit-141101063.html

https://robinhood.com/stocks/KR

https://www.fool.com/investing/2020/09/17/kroger/

https://www.fool.com/earnings/call-transcripts/2020/09/11/kroger-kr-q2-2020-earnings-call-transcript/

https://www.nasdaq.com/articles/why-is-kroger-kr-down-0.8-since-last-earnings-report-2020-10-11

https://www.investing.com/equities/kroger-co-ratios

https://finance.yahoo.com/quote/kr/key-statistics/

https://www.macrotrends.net/stocks

https://searchcloudcomputing.techtarget.com/news/252461682/Kroger-buys-into-Google-Cloud-migration-despite-challenges

https://www.supermarketnews.com/online-retail/kroger-launch-digital-marketplace-fall

https://www.valueinvestorsclub.com/idea/KROGER_CO/0137861977

https://app.koyfin.com/home


Goldman Sachs: A Financial Gem

By Luke Graupmann

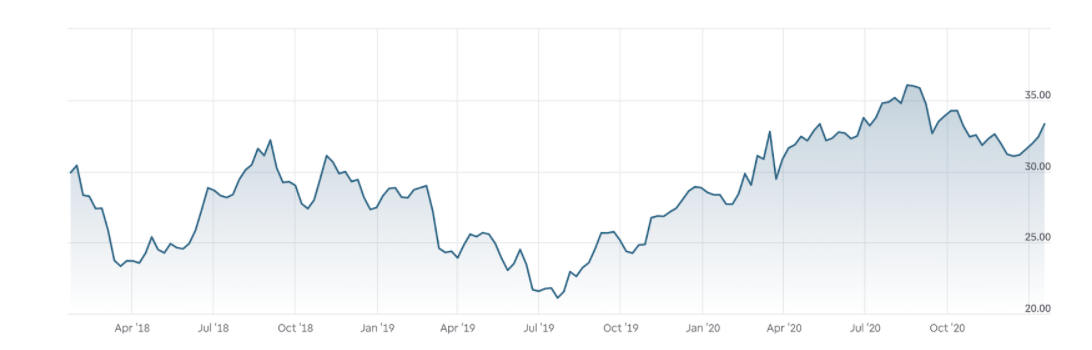
Goldman Sachs (NYSE: GS) is one of the most recognizable names in finance, yet in recent years the company has been overlooked by investors searching for high flying growth stocks. Yet, value is traditionally one of the first areas to recover post recession and it is time to give value plays another look. Goldman is also an incredibly safe play as downside risk is limited as the company trades near book value, which nearly always acts as a floor for banking stocks in a market full of stretched valuations. In addition to this, Goldman offers strong growth opportunities as the company increases its presence in consumer banking and tech. I would advise investors looking to capitalize on the trend towards value to buy Goldman as the company provides a solid value investment with promising growth as it expands into new sectors.

Image for post

Strength of Revenue Streams:

Goldman breaks its revenues into four sources (Annual 2020):

Image for post

Investment Banking — According to Goldman’s Q4 2020 earning results “the firm ranked #1 in worldwide announced and completed mergers and acquisitions, worldwide equity and equity-related offerings and common stock offerings for the year.” Goldman’s dominance in M&A is well timed as low interest rates and newfound interest from corporations in owning and operating supply chains encourages new M&A deals 2021. While the rise of SPACs poses an alternative to traditional IPOs, SPACs do not pose a threat to Goldman’s revenue. Instead, Goldman stands to benefit from an increased number of companies going public through SPACs as the firm manages a large number of SPAC offerings and commands higher fees for its services in SPAC mergers than traditional IPOs. It is also worth noting that Goldman currently faces a backlog of M&A projects and expects elevated demand for their services to continue through 2021.

Global Markets — If you were to conduct a “man on the street” survey where you asked random Americans how Goldman makes money they would undoubtedly point to the global markets segment of Goldman Sachs. They would do this for good reason, Goldman’s global markets division is one of the best on Wall Street and provides nearly half of Goldman’s total revenue. Emerging from the Covid-19 driven recession, Goldman’s global markets division is well positioned to capitalize on a new bull market that will likely last years. However it is worth noting that some of the remarkable revenue global markets produced in 2020 may be hard to replicate as volatility in the market cools off.

Asset Management — Goldman’s asset management division, which manages the firm’s loans and equity investments returned 11% less revenue in 2020 than 2019, reflecting less net revenue from private equity and lower rates of return from loans. A return to normalcy post-covid should raise revenue in this segment. Goldman also increased its loan loss provisions throughout 2020 and has now drawn down its loss provisions to buy back shares as the worst fears of the recession haven’t realized.

Consumer & Wealth Management — Goldman is rapidly growing its consumer and wealth management division and returned a record $6 billion in revenue for 2020. CEO David Solomon considers this segment a key component to the firm’s future and has expanded the wealth management division to better compete with Morgan Stanely. At the same time, the firm has launched its consumer bank Marcus and has its partnership with Apple to issue the Apple Card. Net revenues in consumer banking were up 40% year over year and 10% for wealth management. This news is particularly positive as Goldman is still far from finishing its expansion in consumer and wealth management and revenue will continue to experience large year over year growth.

Growth Catalysts:

Marcus — Goldman offers exciting growth potential in consumer banking with Marcus. Launched in 2016, Marcus is a completely online bank that offers high yield savings accounts, CD’s, personal loans and helps users learn about their financial health. The bank earned #1 in personal loan satisfaction by JD Power and has over $96 billion in deposits. Goldman believes the bank will be a key part of the firm’s future as Marcus becomes a full service consumer bank. Marcus is launching a checking account and Marcus Invest, which will give users investment tools with as little as $1,000. Here Marcus is well positioned to compete against traditional consumer banks and fintech startups. On the traditional banking front, Marcus will benefit from millennials and gen-z transitioning to higher yield online banks like Marcus. At the same time, Goldman’s recognizable name and long history gives Marcus a sense of legitimacy and stability that fintech start-ups cannot replicate. Taken together, this gives Marcus a unique position in online banking that it can leverage over its competitors.

https://www.marcus.co.uk/uk/en

Marcus has also partnered with Amazon to compete with traditional banks to offer small business owners who sell on Amazon.com revolving lines of credit at 6.99% to 20.99%.. This is a major step for Goldman as the firm pushes to offer financing for “Main Street”. The partnership with Amazon legitimizes Goldman’s expansion into tech and provides the firm with access to a massive amount of harvestable data from Amazon sellers.

While Marcus’s revenue was only $1.213 billion in 2020, revenue is up 40% year over year and will rise even faster as Marcus’s offerings expand to fully disrupt consumer banking and compete against brick and mortar banks. Goldman’s valuation is also likely to increase as Marcus grows as we have seen fintech stocks command higher valuations than traditional banks.

Apple Card — In 2019, Goldman partnered with the world’s most valuable company and launched the Apple Credit Card. The card aims to disrupt the credit card industry and reimagine how consumers spend money, encouraging primary use through Apple Pay. Only four months after its launch in November 2019, 3.1 million Americans (2.2% of American credit card holders) had an Apple credit card. Even better, card owners tend to be millennials with higher incomes and 60% consider it their primary credit card. While neither Goldman nor Apple release data on the revenue they collect from the card, Goldman has repeatedly called the launch of the card the most successful in history. Additionally, Goldman has successfully tied itself to Apple’s incredibly loyal customer base. This has led to increased interest in the Marcus checking account, with 50% of card users stating they would open an account when available. With an average revenue per user of about $300 for Marcus[1] [2] , this would be an additional $450 million in revenue without accounting for decreased cost per user added. As such, the Apple Card is beneficial to the company whether or not it is profitable. The true success is Goldman’s new relationship with Apple customers that ensures it is on the cutting edge of how consumers spend their money.

Private Wealth Management — Goldman has provided wealth management for the ultra-wealthy for some time. Now Goldman plans to further push into this space, leveraging its ultra-recognizable brand to win over new clients with smaller fortunes in order to better compete with Morgan Stanley and other firms. Goldman is also expanding its private wealth management business to smaller investors with Marcus Invest. With Marcus Invest the firm will offer a range of ETFs to investors with as little as $1,000. While the firm has not offered what its specific management fee will be it will likely be the industry average of 0.25%. Given the growing interest in investing in the general public and the popularity of Goldman’s ETFs with its wealthier clients Marcus Invest is expected to be popular. The firm has not offered guidance on how much additional revenue this will create. However it is noteworthy there will be very little additional investment necessary for the venture as most of the investment options will just be an expansion of services the firm already offers.

A Great Stock With a Cheap Price:

Goldman is an incredibly safe play as downside risk is limited as the company trades at 1.05 book value. Book value nearly always acts as a floor for banking stocks. In a market full of stretched valuations this downside protection is rare.

Goldman has greatly outperformed earnings expectations on the past three quarterly reports. Looking forward, Goldman is expected to continue delivering strong earnings, with 2022 EPS being 27.73. This implies a 2022 forward price to earnings ratio of 10.5, considering that Goldman will at this point likely have a significant presence in fintech the company is trading at a massive discount relative to fintech peers.

Valuation:

Despite Goldman’s recent rise, the share price remains undervalued, trading at only 1.05 price to book. This is lower than the industry average of 1.36, which is historically low as well. Given the strength of recent earning reports and the Fed’s recent decision to allow share buybacks once more, both Goldman’s and the industry’s book value can be expected to rise.

Image for post

While Goldman trades at a higher price to earnings than several competitors, the valuation is justified by the corporation’s lack of a loan portfolio that has negatively impacted competitors as fears of Covid-19 driven defaults abound. In fact, when comparing Goldman to JP Morgan, who also faces less risk from loan defaults, Goldman’s price to earnings ratio seems reasonable and trades at less than JP Morgan.

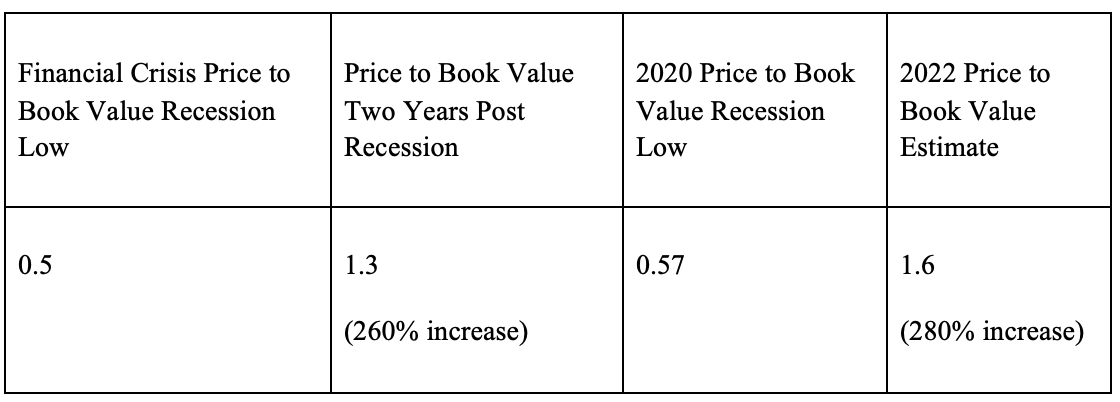
Historically, the financial sector has been one of the first industries to recover from recessions. I will use a price to book estimate for a valuation for 2022. Following the most recent recession, the Financial Crisis that lasted from December 2007 to June 2009, Goldman’s price to book ratio rallied from a low of 0.5 in December of 2008 to 1.3 price to book two years later. During this recession, Goldman’s price to book ratio reached its low in March, falling to 0.57. Using the Financial Crisis as precedent, a significant rise in Goldman’s price to book ratio can be expected in the coming two years. Goldman is much better financially emerging from this recession than it was in 2009 and does not have the negative press nor massive fines it did following the Financial Crisis. Considering these factors, Goldman can be reasonably expected to be trading at a higher price to book value two years from now than it was after the Financial Crisis. Here I will be conservative and assign a price to book value of 1.6 in 2022, which is only 0.3 above today’s industry average.

Image for post

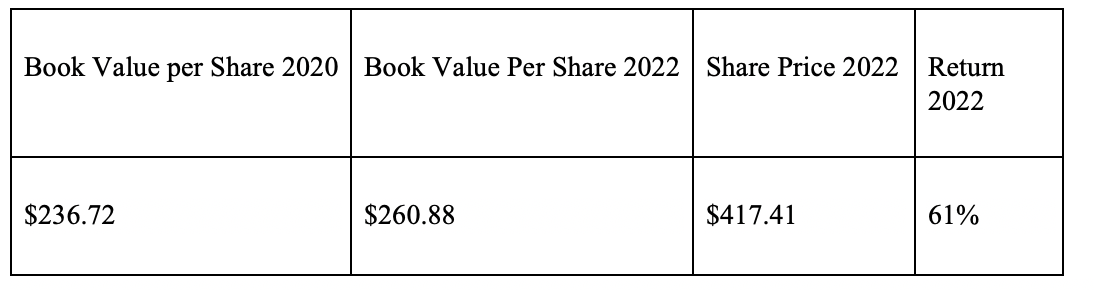
Goldman has an annualized increase in book value of 5% over the past 3 years. Given a current book value per share of $236.72, I forecast book value per share in 2022 will be $260.88 assuming the similar 5% year over year increase continues. Trading at 1.6 book value, share price is estimated to be $417.41, a 61% return from December 28th’s share price of $259.59.

Image for post

Special from London School of Economics Investment Research Group: Getting Schooled on Student Loans


Photo by Tim Gouw on Unsplash


With the Biden administration in power and democrats having unified control of Congress, one market in particular watches with bated breath – Student Loan Asset Backed Securities. With student debt forgiveness becoming an increasingly important message within the Democratic Party as a whole, SLABS have now taken on a deeper political significance, warranting an introductory look into the asset class for investors and non-investors alike.

What are Student Loans?

Student loans in the United states now make up $1.56 trillion of total outstanding consumer debt, trailing just behind mortgage debt to be the second largest consumer debt category. Student loans have historically played a more significant role       in the US higher education system compared to other countries, due to       higher tuition costs       combined with the cultural perception            that higher education in the US is the primary mode to entering the middle class. Private loans are largely handled by Sallie Mae, while federal loans have been spun off into a separate branch, Navient. Federal Family Education Loans, which are reinsured by the government, ended in 2010. Both private and federal student loans are securitized, though the most attractive of these, Federal Family Education Loans, which are reinsured by the government, ended in 2010.

After the 2008 global financial crisis, a meltdown largely caused by the collapse of the housing market and the reckless structuring of Mortgage Backed Securities, many were worried that SLABS could be the grounds of the next subprime crisis. Three main points distinguish SLABS from MBS.          , Firstly they are not collateralized, unlike mortgages which are backed by housing. Secondly, the derivative market for student loans is much smaller than that for MBSs, meaning that leverage is limited and any shocks in the market are unlikely to cause further knock-on effects on the global economy like in 2008 (the macro effects of student loans in general are beyond the scope of this article). And third, student loans are much harder to discharge in bankruptcy compared to other private loans. This last point has made SLABS particularly attractive to investors due to the perceived low default risk

Even before the exogenous shock of COVID-19, there were warning signs that the student loan market could be in dangerous waters. With debt per capita steadily climbing higher but graduate income remaining stagnant, many analysts were skittish on the prospect of mass defaults. Student debt already has the highest 90 day delinquency rate for household debt, and according to the Fed, figures are likely to be understated due to various education loan policies that allow for grace periods and deferments.

What does the Biden Administration mean for the SLABS market?

To get a glimpse of how congressional policy might affect the market for SLABS, consider the effect income-based repayment policies had on the market. Prior to 2010, many student loans were issued by private lenders and guaranteed by the federal government. The Federal Family Education Loans program was ended in favor of direct loans, some of which included provisions to apply for income-based repayment at a later date. In 2015, these fully kicked in, and the resultant default implications caused rating’s agency Moody’s to downgrade several of the ABSs affected from triple A to Ba1 overnight, until issuer Navient got approval from bondholders to extend the maturity date of the bonds. In fact, July of 2020 saw $38 billion worth of SLABS being downgraded due to similar concerns over loans failing to repay at maturity.

Any debt forgiveness plan pushed through by the Biden administration would have the opposite effect. With the federal government effectively guaranteeing a portion of student loan debt, the risk premium for SLABS would greatly reduce, resulting in a fall in yield and rise in prices. However, this is looking increasingly unlikely, as the administration continues to slowly phase out student loans from their platform, with Biden being on record as being “unsure” of using executive authority to enact widespread student loan forgiveness. The macroeconomic implications of loan forgiveness goes beyond the scope of this article.

Delinquency Rates: A measure of value?

The perennial question is then: is a student loan crisis imminent? In the case of asset backed securities, one popular metric is examining the delinquency rates of the underlying debt. If delinquency rates are higher than projected, then the value of the income stream is reduced, and the value of the ABS correspondingly drops.

During the 2008 financial crisis, investors such as Michael J Burry and Steve Eisman were able to predict the forthcoming financial crisis by analysing the underlying mortgages that supported the MBS/CDO/CDS structure, and realising how risky they actually were compared to their ratings. Post-2008, significant reforms have been made to credit rating agencies. The most notable      of these have been the Dodd-Frank Act which have sought to improve the accuracy of credit ratings, but the inherent incentive problem within the system      (with issuing firms themselves paying for ratings),      leads many to question its reliability,      although some argue that such issues may be overblown     .

Data Analysis

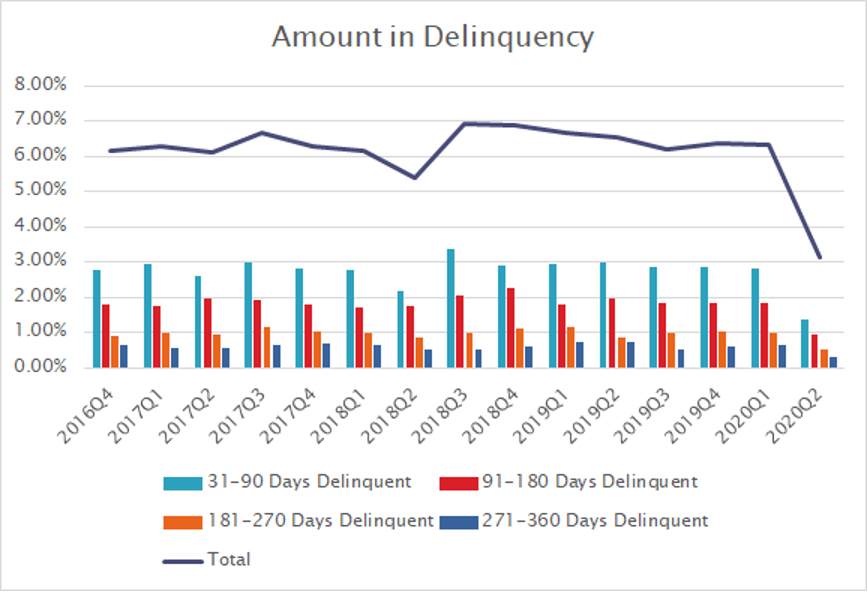
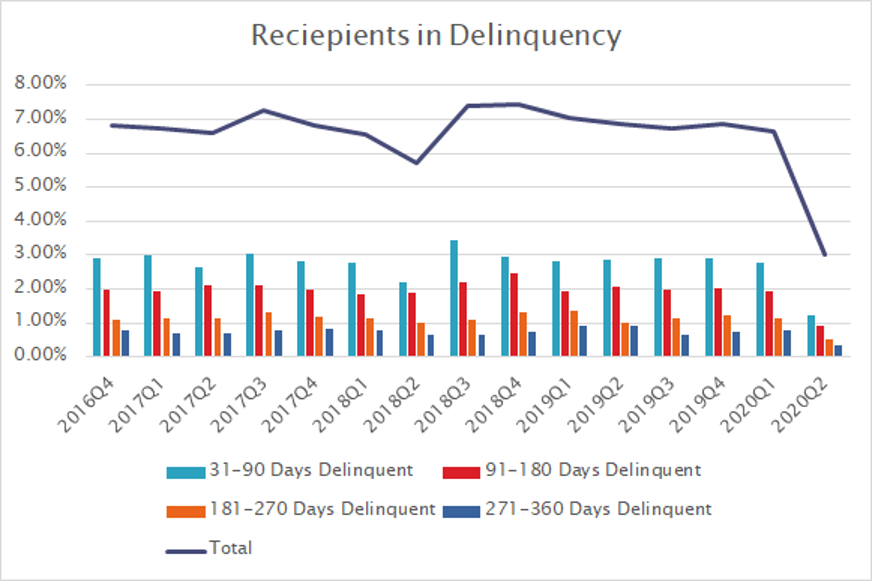
We draw data from publicly available delinquency rates from the Federal Student Aid board and use it as a proxy for the entire debt market, noting that delinquency rates for private loans are likely to be lower (given the lower interest rates for Federal loans, many prioritize payment for private loans).

Analysing the available delinquency statistics at first glance, it seems that outcries over default are overblown. Delinquency rates show no obvious upward trend on a percentage basis, both in terms of dollars outstanding and raw number of recipients (in fact, these two figures seem to trend closely together, contrary to expectations with regards to recent trends of higher borrowing amounts per capita).

Here we note the significant dip in delinquency rates in the 2020 period, attributed to COVID-19 emergency debt relief for Department of Education (ED)     -held student loans. This is significant as the economic impact of COVID-19 has not been factored into these statistics.      While US unemployment figures have fallen       to       new lows                 in recent months owing to the pandemic, analysts warn       this likely underestimates the true scale of unemployment,            due to an overall decrease in active labour force size as well as furloughed staff. Furthermore, loans which are currently held in deferment or forbearance are also not reflected within these statistics, which amounted to roughly $255 billion in Q3 of 2019.

The Future of Student Loans

Ultimately, the sentiment on Student Loans depends heavily on a number of factors. By order of importance, they are: 1. Any form of student loan forgiveness that the Biden administration may push through 2. The economic outlook and recovery for the US post COVID-19. 3. Changes in laws regarding student loan bankruptcy, especially after the Rosenberg ruling in January 2020, where the courts ruled in favour of discharging the student loans of a Navy veteran.

With 1 looking increasingly unlikely, I doubt that SLABS are going to be the next hot investment. But I also believe that doomsayers are overblowing the situation. Even in the case of a rough economic downturn and massive unemployment, we would additionally have to see a record number of loans discharged in bankruptcy courts, as well as a complete failure on the part of issuers to renegotiate the terms of the loans and bonds. Lingering skittishness over similarities to the 2008 MBS crisis should be tempered with a reminder that said crisis was rootly caused by a bubble in the US housing market. And while there are some arguments that the value of a college degree may be overstated, most literature finds that there are definite returns on wage from a tertiary education – far from a bubble.

Overall, student loan asset backed securities seem to be a “hold” investment at best. Given the lack of macroeconomic consensus on the effect of student loan forgiveness, we are unlikely to see any sweeping policy changes to the fundamental loan structure in America any time soon. That, combined with increasingly mandatory (and expensive) university degrees means that SLABS as we know them are here to stay.

—-

This article is part of a series of publications created in cooperation with LSE SU Investment Research Group. Investment Research Group is a London School of Economics Society of 80+ analysts, dedicated to teaching financial skills and publishing articles on a wide range of categories such as: equities, fixed income, macro trends and alternative markets. To find more articles like this one click here: https://medium.com/lse-irg 
Bryan Ling is a Research Associate for Fixed Income at the London School of Economic’s Investment Research Group, reading Economics.
 
Our publications do not offer investment advice and nothing in them should be construed as investment advice. Our publications provide information and education for investors who can make their investment decisions without advice. The information contained in our publications is not, and should not be read as, an offer or recommendation to buy or sell or a solicitation of an offer or recommendation to buy or sell any securities. Our publications are not, and should not be seen as, a recommendation to use any particular investment strategy.”

GoPro: Capturing Distressed Action-camera Maker’s Comeback [SOLD]

By David Shakirov

Update 03/11/21: The author recommends disposing of this stock. GoPro saw a dramatic rise in its price from the pandemic lows of $2/share to highs of $12-13 in the aftermarket last month. At this price, GoPro is almost fairly valued. However, there are concerns over management’s ability to cut operating expenses to $250m as promised (the new guidance is $305-315m) and to minimize churn on their new GoPro + subscription service. GoPro could be a $15-20 stock, but given our gain of 130% and the foreseeable risks, Insight recommends readers to sell their shares. 

In 2002, Nick Woodman strapped a cheap plastic camera onto a wristband and shipped the homemade prototype to a manufacturer in China. Twelve years later, GoPro went public at  a $3B valuation, under the premise that everyone was in the market for its action cameras. Over the course of the next four years, GoPro failed to release new cameras, began pitching itself as a “media company” and manufactured a drone that turned into a commercial disaster. Its market value plunged from $90/share to $3.38 earlier this year.

Woodman (pictured above), a major shareholder in the company, began to reorganize the business back to its roots as a consumer electronics company. He cut corporate costs drastically (OpEx margin from 68% to 38%), banked on best-in-class high end products, and offered professional video tools for its users. GoPro plans to continue on this path by expanding its TAM (total addressable market) and top line by products like VR, while improving gross margins and settling into bottom line profitability. Even better, Nick Woodman spoke out recently and said that GoPro “crushed” the Black Friday + Cyber Monday shopping season, beating last year’s revenues by a whopping +120%, capturing 97% share of the action cam market.

GoPro’s main pitch to investors is its massive operating leverage stemming from growth opportunities over the next ~3 years. GoPro plans to (1) cut its operating expenditures from current levels (~$400-500M) to roughly $250M, (2) focus on growing ASPs dramatically with a focus on high-end cameras. (3) moving DTC to expand margins, and (4) banking on high margin recurring revenues from its GoPro Plus subscription service.

Let’s dive deeper into how these growth opportunities will continue to play out:

GoPro is huge on cost cutting — an initiative to run lean and create huge operating leverage. With operating costs of ~$400m/year, Nick Woodman announced he is cutting expenditures and headcount to manufacture roughly $150m of savings per year. If only half-baked and translated to $75m of profit at a low 10x P/E multiple, this initiative alone values GoPro above its current market value.

GoPro is focusing on high end (and high margin) cameras (like the Max, which retails at $499 vs. $299 for cheaper GoPros) which significantly increases ASP (average selling price). Even better, the demand for these higher end cameras is up 90% YoY, with cameras above $300 ASP representing 95% of sales. The new Hero 8, a high end offering, had 40% more first-month sales than any GoPro offering in history. Conservatively, if high-end cameras can improve GM by 500bp, that is roughly $60m of profit to be realized.

A shift to DTC (selling on GoPro.com instead of Walmart/Target/etc.) should expand profitability significantly, as well. The company mentioned that gross margins on the GoPro website are 500-1000bp higher (north of 40%). Selling directly on the website also improves cross-sell opportunities (e.g. GoPro Plus subscription, accessories, etc.) and improves data collection on what customers want and how they shop. The margin improvement alone, if achieved at the lowest bound, should bring roughly $50M of profit into the business.

GoPro is also expanding its their new subscription platform, GoPro Plus. Plus costs five bucks a month and gives users cloud storage and small discounts on accessories and cameras. It’s a high gross margin recurring revenue stream that builds loyalty. At the current rate, subscription numbers are growing at +20% quarter-on-quarter and GoPro is guiding $60-70m of recurring revenues from this service. At conservative 70% margin, this adds $40m of profit to the business.

That’s $225m of profitability if you’re keeping count.

Some other less quantifiable but still important catalysts —

(1) Potential of expanded TAM, by venturing into VR or other verticals. Woodman cites a magnified $13B TAM in GoPro’s future.

(2) Its brand name is a significant advantage. GoPro’s new products are backed by a reputation of “best-in-class”. More generally, consumers rarely “shop around” for action cams — they simply buy GoPro (which is why it captures 97% dollar share of the action cam market).

(3) Acquisition potential is notable, as well. Major tech companies are sitting on a pile of cash (like Apple’s $250B piggy bank, for instance. Buying a best in class tech hardware company like GoPro that makes sleek and sexy electronics might make some sense. Apple is reported to release a major piece of VR hardware in a few years, while Google just bought distressed consumer electronics company Fitbit. Even an LBO from management would not surprise me.

If we add all of the potential profitability as noted above, we can back into a $225m operating income business in just a few years. We are not even including the brand name, acquisition potential, or TAM expansion. By that hyper-conservative logic, GoPro, a premium consumer electronics and technology company is now trading at 3x 2022 EBIT. That’s right, a tech company at a 3x EBIT multiple. A bargain if there ever was one. Or, as Peter Lynch would say, a four-bagger home run.

Recommendation: BUY at the current price of $4.02