A rain shadow map of where people stood at the rally on Monday.
Rain shadows
Reply

And ART.
http://www.ted.com/talks/nathalie_miebach.html#.TqH0J36xzfk.facebook
I think this is a fascinating look at ways that one can visualize something (or map it), then create art from that visualization.
Hope you enjoy.
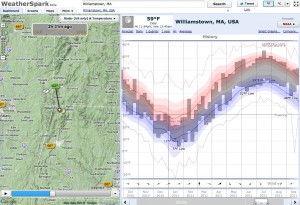
 WeatherSpark is an excellent weather data visualization tool, including radar map video, temperature histories, forecast, daily averages, historical trends, and comparative weather charts…And very attractively presented.
Here’s the WeatherSpark map of Williamstown.