Arriving in the Berkshires
I arrived at Williams as a freshman never having visited the campus. Despite the admissions webpage’s best efforts to warn me, I was still shocked by the beauty of the mountains. Various trips to Pittsfield and Albany, mountain day hikes, and other excursions took me outside the main campus, but I couldn’t keep track of all the mountains, and I had little to no sense of the Berkshire geography. I put off looking closely at a map to orient myself because I kept thinking this would all be so much easier if I could just run my fingers over a topographical map of the area.
Creating Meaningful Gifts
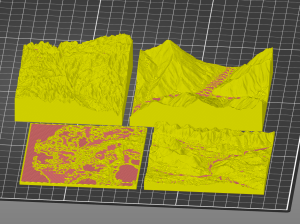
Last semester, I decided that a 3D printed map of Williams would make a nice gift for my friends who were graduating. And, with the help of the website https://touchterrain.geol.iastate.edu/ and David Keiser-Clark at the makerspace, I made it happen. It was actually pretty easy. Touchterrain let me trace out the area I wanted a map of and download the elevation data as an STL file, which I sent to David, who got it printed.
The Process
When I first came to the Makerspace with an STL file of the Williams College campus, my goal was simple: create something meaningful for my graduating friends. I wanted to give them a small, lasting reminder of the place where we had spent the past four years. That idea soon grew into a larger project, with maps of Williamstown for several friends and a special map of coastal Louisiana for someone whose thesis focused on flooding in that region.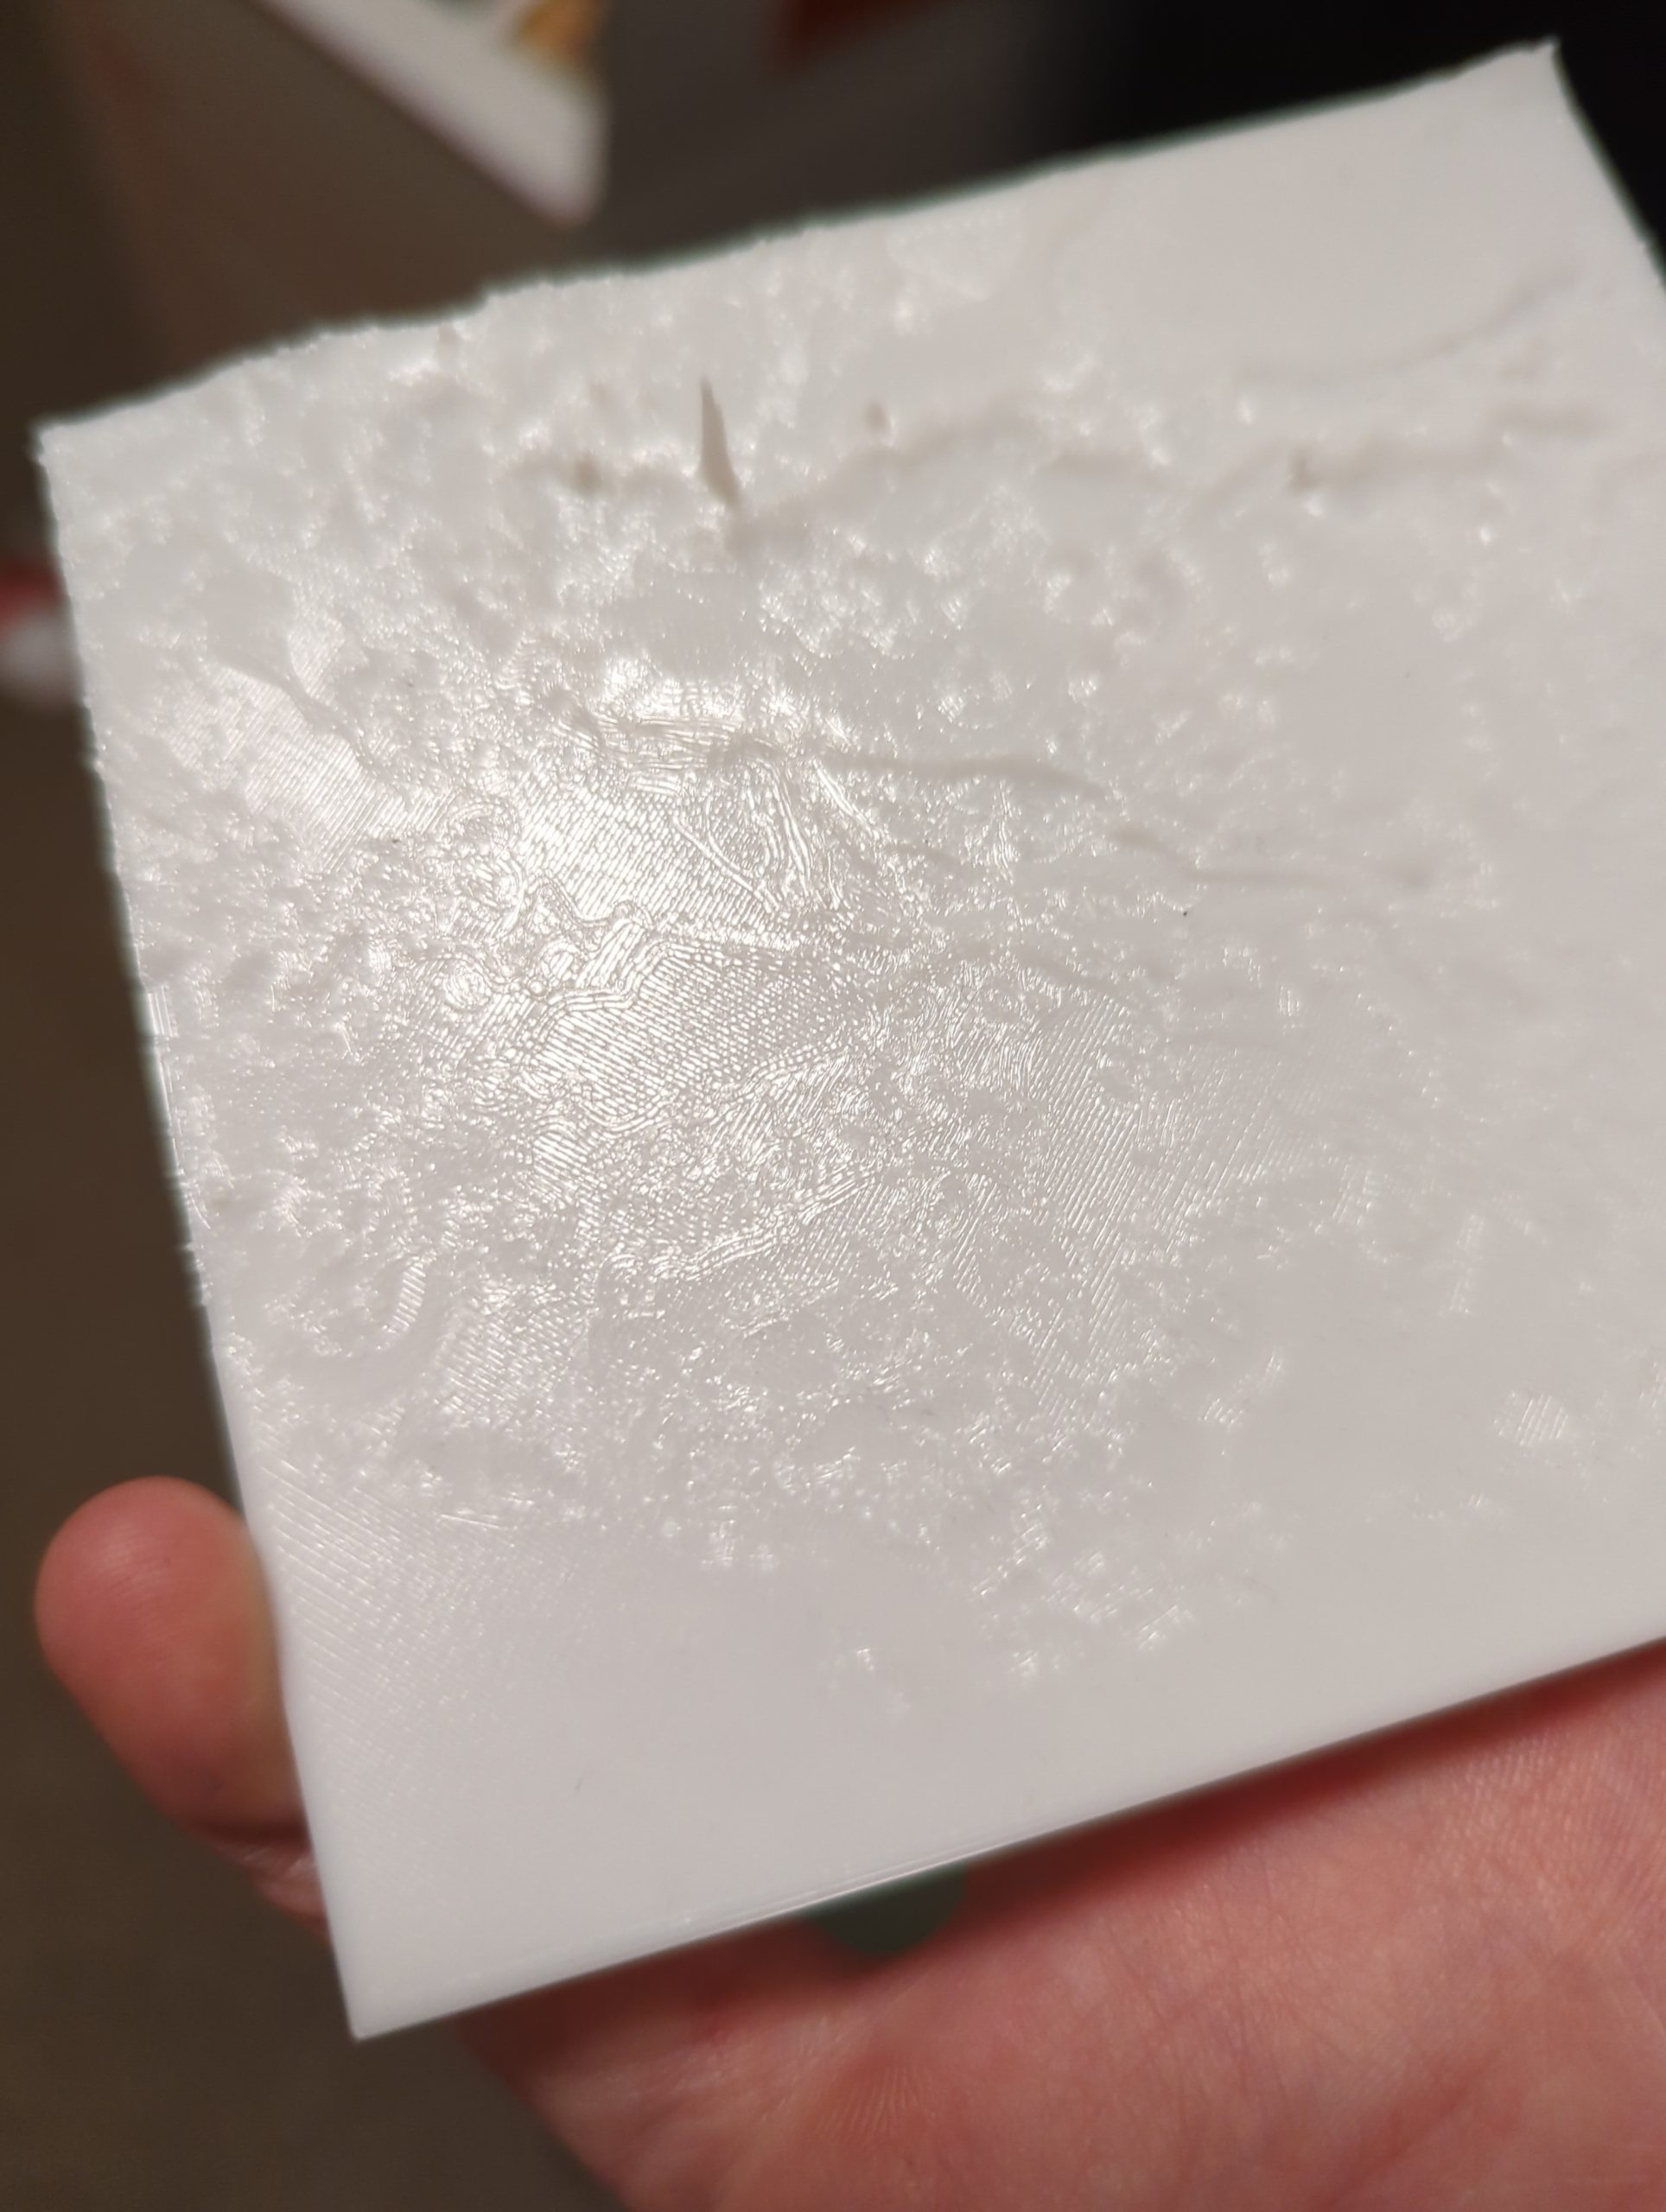
In addition to maps of Williamstown, we printed Paro, Bhutan for one of my friends who had studied abroad there and part of the Louisiana coastline (with the height scale exaggerated 500 times) for another friend who did his thesis on natural-technological disasters in that area and relied heavily on elevation maps.
The only map I kept for myself was a map of Amman, Jordan, where I studied abroad during my gap year. I returned there this summer thanks to funding from Williams’ Wohabe Fellowship, and one of the best parts of my trip was using my map to better understand the geography. By the end of my weeks there, I had a really solid grasp of the layout of the western side of the city and could place my memories from mysemester there in my mental understanding of the area.
I’m really grateful to the Makerspace and David for helping me print these maps, and for anyone interested in 3D printing topographic maps at Williams, I’d recommend multi-colored filament so that the layers of the map change color with height and I’d warn that when painting a white print, some of the paint can find its way inside the plastic and get stuck there. (Also, for anyone looking for a good, online topographic map, I recently found the website https://en-gb.topographic-map.com/, which overlays color-coded elevation data onto Google Maps).
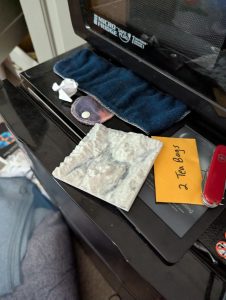
At the Makerspace, I experimented with materials and techniques. I tried different filament colors to see which would make the contours stand out best. For the Louisiana print, by exaggerating the elevation by 500 times, I brought out subtle topographical changes that are normally almost invisible. This choice created a striking visual effect and started conversations about how we interpret geographic data and how exaggeration can be used to reveal patterns that might otherwise go unnoticed.
Final Reflection
The final prints are more than just maps. They are pieces of memory, friendship, and curiosity. They invite touch and exploration. For me, they represent a way to connect academic learning, travel experiences, and personal relationships. For the friends who received them, they are a reminder of place and community at a moment of transition.