Porsche – An Iconic Symbol of Wealth that Might Just Help You Grow Yours

Authored by Luke Graupmann


Porsche – An Iconic Symbol of Wealth that Might Just Help You Grow Yours


Overview:

Porsche SE Holdings (OTCMKTS: POAHY) trades as an ADR over the counter in the US with a convoluted holding structure that mostly owns Volkswagen equity. To be clear, when investors buy Porsche SE, they are not directly buying the iconic car company, which is known and will be referred to in this article as Porsche AG. This limits investor enthusiasm but creates a compelling opportunity to buy Volkswagen at a ~37% discount compared to its own shares. Beyond this discount, Volkswagen itself is positioned for significant multi-year earnings growth as it transitions to electric vehicles and it gains market share in Europe. Finally, while providing stable returns through its Volkswagen investment, Porsche SE’s stock offers the chance for massive returns from a spinoff of Porsche AG (the actual car company) for an IPO listing. In this article I will first dig into Porsche SE’s financial structure and why it offers a discounted price on Volkswagen equity before examining Volkswagen’s underlying business and the implications of an IPO listing of Porsche AG. 


Financial Structure:

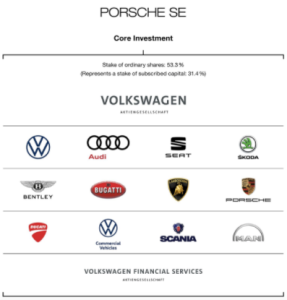
In a complex financial structure Porsche SE owns 53.3% of Volkswagen’s equity. Volkswagen itself then owns and manufactures its car brands, including Porsche AG. This breakdown is seen below. 
 

Beyond Volkswagen, Porsche SE also holds promising investments in industries auxiliary to automotives, specifically companies specialized in automotive software, lidar, 3d printing, traffic analytics, satellites and their launches and the semiconductor industry. 
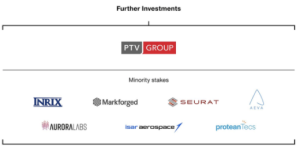


While these investments are promising and offer some upside, over 90% of Porsche SE’s invested capital is in Volkswagen, so I will now turn my attention to how Porsche SE equity is valued compared to its underlying investment in VW. 


Since Porsche SE owns 53.3% of VW’s equity, its market cap should be roughly 53.3% of Volkswagen’s $135.2 billion market cap, about $72 billion. 


However, Porsche SE’s current market capitalization is only $28.5 billion, 60% less than the implied market cap. While part of this discrepancy can be attributed to the $10.8 billion in legal claims against the holding company, this does not fully account for the discrepancy. Even if Porsche were forced to pay the maximum amount of legal claims against it, which seems significantly unlikely given comparable rulings against VW, Porsche SE still trades at only 54.6% of its underlying equity in VW and means that as an investor you are getting Porsche SE’s auxiliary investments for essentially nothing.
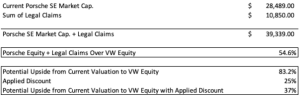


This discount is likely due to the complex financial structure of Porsche SE and has historical precedent. In each case where such a discount in Porsche compared to VW equity has occurred before, Porsche SE has eventually caught up to within 25% of VW’s valuation. Applying this discount, Porsche SE becomes a compelling arbitrage opportunity, providing roughly 37% upside from current valuation when compared to its underlying investment in Volkswagen and subtracting 25% to account for the discount. However, investors should not just use Porsche as a quick arbitrage opportunity but buy its stock as a long term investment in VW at a discounted price.


Volkswagen’s Transition:

In 2015 Volkswagen appeared to be a company near collapse. So called “dieselgate,” where the company programmed cars to lessen their emissions when tested for regulatory compliance then increase emissions when on the road for better performance and fuel efficiency had just been uncovered and the company faced tens billions in recalls, buybacks and legal fees. In just a few months the stock halved and calls to break up the conglomerate emerged. Since then, Volkswagen’s stock has not only recovered but returned 141% since 2016, outperforming the S&P by 20%. VW’s sizable investment in battery technology, electric vehicles and portfolio of high margin luxury vehicles promise to accelerate these returns over the next five years. 


VW research has committed ~$81 billion to battery factories, tech and charging stations through 2025 and completely phase out gas cars by 2030. This massive investment is needed, the company’s investments in EVs and rollout of EV cars has fallen behind both new EV companies like Tesla and legacy automakers like GM and Ford in their EV transition and innovation. However, the company has now committed to producing 1 million EVs by 2023, a goal it is currently on track to achieve. It also plans to expand its European charging network to 18,000 charging stations, which will allow it to collect recurring revenue from its EVs on the road and further market its EVs as practically useful. Volkswagen already has several EVs on the road across a spectrum of brands from premium to affordable, allowing it to compete with Tesla on all fronts and extract high margins on its luxury Porsche and Audi EVs. 


Volkswagen also has a locational advantage among legacy automakers in the EV race. With 26% of automotive market share in Europe and 20% of market share in China VW is well positioned to to roll out its EV lineup to a receptive market. Together Europe and China represent the two largest EV markets, respectively making up 43% and 41% of the entire EV market. This creates a competitive advantage for VW compared to Tesla and legacy automakers in the two largest EV markets as it leverages existing relationships into EV sales in two critical automotive markets that will likely decide who wins the EV race. This is particularly important in the short term as EV margins for the short term are expected to be lower than traditional cars due to battery development costs. VW can help makeup some of its lost profits from margins with higher volume, which appears likely as they leverage existing market share into future EV sales in critical markets.


3 Year Valuation: 

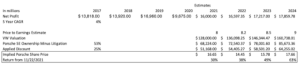
Volkswagen’s EV transition should also help increase its earnings multiple, which is currently only 7.7 price to earnings. This is below major competitors despite a similar EV strategy, strong battery tech, higher EBITDA margins and dominant market share in strategic markets. Looking at GM, Ford, Daimler, BMW and Toyota for comparison, the industry average is 10.5, however this average is skewed by Ford, which trades at 26.4 price to earnings, more than double the nearest competitor. Thus, for conservative estimates I will ascribe VW a multiple of only 9 in 2024. Modelling earnings, I estimated that earnings will continue to grow at its historical 5 year CAGR, which is conservative given the EV transition in Europe is expected to expand VW’s market share and long run margins should be similar to ICE cars. This results in a 2024 earnings of $28.3b, which multiplied by 9 implies a valuation of Volkswagen of $229.4b. From here valuing Porsche just requires multiplying VW’s valuation by Porsche’s ownership stake. Once again, to be conservative I have subtracted Porsche’s total possible litigation expense from its valuation and a 25% discount. This gives a 2024 share price of $17.66, returning a respectable 63% from 11/3/2021.
Spinoff

There is also a significant chance that Volkswagen chooses to spin off Porsche into a separate company with an ipo listing sometime within the next few years. Such calls have been repeatedly called for by major investors and management appears receptive to the idea because of the high probability for a higher valuation of Porsche separately (makes up the largest portion of VW’s profits and is a higher margin, more stable business than the other brands). Such a spinoff also have historical precedent as Fiat Chrysler spun off Ferrari in 2015. This spinoff was a major success, investors in Fiat Chrysler were given shares in the new company (which has since quadrupled in value and trades at a much higher valuation) and Fiat Chrysler stock more than doubled in the next few months. A similar outcome that gives Porsche Holdings cash and investors direct shares in Porsche AG appears likely where Porsche AG to be spun off.


Overall:

Overall Porsche is a compelling investment that offers a 37% discount to VW’s equity while accounting for a 25% equity discount. At the same time, VW itself is a strong investment. Because of this, Porsche is a buy.

Intuitive Surgical

Authored by Adrian Moeller

Fall 2021

Williams Insight

Intuitive Surgical

Recommendation

Intuitive Surgical is a strong buy over a long-term, 5-7 year horizon. The Ion Endoluminal Platform and the post-COVID boom will drive growth over the next 1-5 years, and international markets and machine learning advancements will drive growth over the next 4-7 years.


The Company

Intuitive Surgical (NASDAQ: ISRG) is a developer, manufacturer and distributor of robotic medical implements, accessories, and services. Intuitive Surgical (Intuitive) was founded in 1995 and is headquartered in Sunnyvale, California. Intuitive Surgical primarily engages in the development, production, and sale of two robotic devices, the da Vinci Surgical System and the Ion Endoluminal Platform, as well as accompanying accessories, software, and servicing.

The da Vinci Surgical System is used in robotically assisted surgical procedures. The most common procedures are prostatectomies, cardiac valve repair, and gynecologic procedures. The da Vinci’s precise and minimally invasive approach to these delicate and complex procedures has been shown to improve patient outcomes through shorter hospital stays, lower blood loss, lower risk of infection or complications, and reduced pain. The da Vinci Surgical System was the first robotically-assisted surgical system to receive FDA approval in 2000, and Intuitive has developed three iterations since initial approval: the Xi, X and SP. In addition to developing, manufacturing, and distributing the da Vinci Surgical System, Intuitive also develops, manufactures, and distributes accessories for the surgical system. Intuitive similarly engages in the sale of surgical software, training software, servicing, and maintenance of its da Vinci Surgical System units.

The Ion Endoluminal Platform is Intuitive’s latest product, receiving FDA approval in 2019. The Ion Endoluminal Platform performs minimally invasive robotically-assisted bronchoscopies. This procedure allows for a detailed scan of lung bronchioles, creating rich three dimensional scans used for detecting lung nodules and determining whether they are malignant or benign. Intuitive Surgical has stated they are introducing the Ion Endoluminal Platform to market in a ‘measured fashion’. The Ion Endoluminal Platform’s business model operates similarly to that of the da Vinci system – through the development, production, and sale of the system itself, and accessories, software, and servicing of the units.


The Industry

The robot-assisted surgical systems industry is expected to grow at a CAGR of 17.6% over the next 6 years, valuing the industry at $17.8b by 2027. North America currently holds the dominant market share, both in the production of robot-assisted surgical systems and the number of surgeries performed by robot-assisted surgical systems.

Although other domestic players such as J&J, Stryker, and Medtronic are vying for market share, Intuitive Surgical has been the clearly dominant player for the past three decades. Intuitive Surgical benefits from having a first-to-market advantage, being the first company to receive FDA approval for a robot-assisted surgical system. Since then, other firms have received FDA approval, but none have been able to develop systems as advanced as Intuitive Surgical’s da Vinci System. Additionally, generations of doctors have been trained on the da Vinci system, and hospitals and clinics have made heavy investments in Intuitive’s products. These factors have made Intuitive Surgical’s market share remain dominant.

Revenue Streams

Intuitive Surgical sells the da Vinci Surgical System at anywhere between $1.8 and $2.3 million per unit, depending on the specification and accessories. Intuitive Surgical also leases the da Vinci Surgical System to hospitals and clinics at $80k to $190k a year.

The Ion Endoluminal System has not yet fully entered markets. Intuitive Surgical has stated that revenues and gross margins have not yet been impacted by the Ion Endoluminal Platform.

In addition to the sale of their surgical systems, Intuitive Surgical also engages in the sale of accessories, software, and servicing of the da Vinci Surgical System, as well as the Ion Endoluminal Platform. At present, the Ion Endoluminal Platform’s absence from markets has placed a higher burden on the da Vinci system to drive revenues. Intuitive Surgical creates and sells the software required to operate the da Vinci system, as well as the software used by medical schools to train surgeons to use the da Vinci system. Each da Vinci system costs around $180k/year in maintenance, and is serviced by Intuitive Surgical specialists. Finally, each surgery conducted using the da Vinci system costs around $6,000 in accessories, such as plier attachments, scissor attachments, and the like. Such accessories have a 10-12 surgery life span before requiring replacement. These accessories are solely produced and sold by Intuitive Surgical.

Accessories, software, and servicing have created stable recurring revenue streams for Intuitive Surgical. 77% of Intuitive Surgical’s revenue’s have come from these recurring revenues, and its share of revenue has been growing steadily over the past 4 years. 

Financials

Financial fundamentals are listed below.

Stock Price $346.14 EPS (TTM) $4.64
Shares Outstanding 357.24M P/E (TTM) 75.26
Market Cap $122.74B YoY Earnings Growth 21.20%
EBITDA 2.09B Operating Cash Flow 2.15B


Growth

Intuitive Surgical faces high opportunities for growth in markets outside the US, in advancements in AI and machine learning, new product launches, and post-COVID growth.

The American market accounts for over two-thirds of Intuitive Surgical’s revenue. Expanding health systems in East Asian markets present a substantial growth opportunity for Intuitive Surgical. Although foreign regulators have historically restricted the entry of Intuitive Surgical to their markets to stimulate their domestic market, regulators have recently started to shift their stance. The inability of foregin companies to produce technologies as advanced as Intuitive Surgical’s and the demand for robot-assisted surgical systems have incentivized regulators to allow the sale of the da Vinci Surgical System, as evidenced by recent South Korean approval in 2019. The large addressable market in East Asia presents a large growth opportunity for Intuitive Surgical. 

The development of machine learning also allows for expanded applicability of Intuitive Surgical’s systems. A recent innovation, Iris, uses machine learning to create three-dimensional images of kidneys. Iris exemplifies the growth potential for machine-learning in Intuitive Surgical’s systems. Machine learning can create value through improved technologies that open new market opportunities for Intuitive Surgical to enter.

The launch of the Ion Endoluminal System also presents a growth opportunity for Intuitive Surgical. Intuitive Surgical plans to follow the da Vinci’s highly profitable business model for the launch of the Ion Endoluminal System. The future sales of Ion Endoluminal Platform units, as well as the following recurring revenue to come from the sale of the units will drive high growth for the coming 2-3 years. Intuitive Surgical has also created a $100m venture fund to acquire nascent health technology startups, which can aid their product creation process and drive further growth.

Finally, a post-COVID boom in elective procedures will drive revenues by increasing demand for surgical systems in hospitals, as well as higher spending on accessories and servicing. Although this boom will only drive growth in the short-run, it can be expected to show strong returns over the next 12 months.

Silvergate: A Unique and Attractive New Banking Model

Authored by Nick Harrington


Overview

Silvergate Capital Corporation (NYSE:SI) is a mid-cap financial services company that has one of the most unique and attractive business models in the sector.


Founded in 1988, Silvergate began its life as a standard commercial bank. In 2013, Silvergate launched its digital currency initiative, seeing an unmet need for traditional banking services in the cryptocurrency sector. This pivot has been outstandingly successful, boosting Silvergate’s market cap from $270mm in October 2020 to nearly $5.7bn as of 11/24/2021.


Core business model

Silvergate’s business model is somewhat unintuitive, but it is critically important to understand. Silvergate’s key product is something called the Silvergate Exchange Network (SEN), a payments platform that Silvergate’s institutional clients — exchanges, hedge funds, asset managers, fintech companies, etc. such as Fidelity, PayPal, and the CME Group — use to instantly settle large cryptocurrency transactions. The SEN’s utility stems from the fact that cryptocurrencies trade 24/7 with no regulated market hours, making them somewhat incompatible with the existing financial infrastructure, which operates on a more rigid schedule. If a hedge fund wants to purchase a large quantity of bitcoin from a crypto exchange, the bitcoin can be transacted instantly but the USD payment will take somewhere from several hours to several days to complete using traditional electronic funds transfer methods, inducing capital inefficiency, friction, and counterparty risk. This is where the SEN comes in. If the imagined hedge fund and crypto exchange are both on the SEN, the hedge fund can transfer USD payment directly from its SEN account to the exchange’s SEN account, instantly settling the transaction and eliminating the negative effects associated with the lag time.


It is hard to understate how valuable this service is. The SEN’s extreme utility has resulted in SEN deposits increasing 447% YoY from $2.1bn to $11.5bn as of Q3 2021. Quarterly transaction volume on the SEN increased 341% YoY from $37bn to $162bn. 99.3% of Silvergate’s deposits are now non-interest bearing, bringing its cost of funds to zero basis points. The SEN’s rapid growth shows how valuable crypto market participants find the network. And because the SEN is so value-additive, Silvergate is able to bring in deposits without paying out any interest; Silvergate then invests these interest-free funds in interest-bearing instruments, earning a profit on the (abnormally high) spread between these two rates, all thanks to the SEN.


Network effect

High growth and profitability are not enough on their own to indicate an exceptional business. There is no guarantee that a high-growth company will be able to sustain that growth (and the same can be said for margins). Fortunately, this is not the case with Silvergate. The most important thing to understand about the SEN is the powerful network effect it produces. Because the SEN is more or less creating a marketplace between buyers and sellers of cryptocurrencies, each incremental user of the SEN makes the network more valuable for all other users. In this sense, the SEN is not too different from a social network like Facebook, which is so dominant not because it has the best technology or the most superior user experience, but simply because it has the most users. It would be trivial for a competitor to create a platform similar to the SEN; it would be much harder to induce institutional crypto traders to actually use that platform, since the value of the platform comes from its participants.


Indeed, the SEN stands out amongst comparable networks in terms of the strength of its network effect. As hegemonic as a platform like Facebook may be, it’s relatively low cost for a Facebook user to open up an account on a competing social network to try it out. Alternatively, consider a company like Airbnb. Airbnb enjoys a similar network effect, since it provides a platform that connects those seeking accommodations for rent with those offering them. However, Airbnb suffers a similar problem: hosts on the Airbnb platform are also able to list their properties on VRBO or Booking.com. As strong as the Facebook and Airbnb networks may be, they’re made vulnerable by their inability to prevent users from moving to competing platforms. The SEN is different — since SEN usage by definition requires a deposit into the SEN, participants find themselves bound to the SEN. They could make a parallel deposit in a competing exchange network, but doing so would require an unnecessarily large capital commitment. 


Collateralized lending, stablecoins, and more

The SEN is the core of Silvergate’s business. However, part of what makes Silvergate such an attractive investment is that it’s more than just the SEN — the SEN also serves as the foundation upon which a broad suite of services can be offered, opening up multiple avenues of growth. For example, Silvergate has been growing its SEN Leverage product, which offers institutional traders participating in the SEN access to USD loans collateralized by bitcoin. SEN Leverage loans totaled $322.5mm in Q3 2021, up from $35.5mm a year prior, and the program has not yet incurred a loss.


Valuation

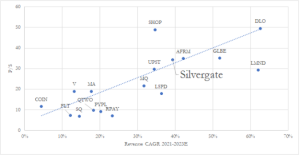
Silvergate is a quickly-growing, highly-profitable first mover with a very compelling business model in a nascent sector. But how much is it worth? This is where things get tricky, because the market has begun to recognize Silvergate’s potential. When I first pitched Silvergate to Insight on October 27, it was trading at $147/share with a 23.5x sales multiple. When I first pitched it to a buyside PM on September 8, it was trading at $111, 20.2x sales. Since then, a few pieces of highly favorable sellside coverage have sent shares sharply higher to today’s close of $222.13, 35.5x sales.


At 20x sales, Silvergate was extremely undervalued. Its growth profile, margins, and business model were vastly superior to similarly valued companies. At 36x sales, things are less clear cut.

Silvergate combines high margins with high growth, and the SEN’s network effects mean that this can be sustained over an abnormally long time horizon. Furthermore, the underdeveloped nature of sector in which Silvergate operates augurs opportunities to grow beyond the SEN and provide a wider suite of financial services to the cryptocurrency sector. With all of this in mind, Silvergate remains very attractive despite recent price appreciation, and I expect its shares to outperform over at least a 3-5 year time horizon.

Visa: A Veteran in Electronic Payments With More Room to Run

Authored by Thomas Dean


Visa: A Veteran in Electronic Payments With More Room to Run


Overview:

Visa (NYSE: V) is one o f the world’s largest electronic payment networks. Currently, Visa dominates the consumer to business (C2B) segment of the electronic payment industry by facilitating transfers of money from debit cards, credit cards, prepaid cards, and a global network of ATMs. Visa processed 140.8B transactions and transferred 8.8T dollars fulfilling these services for consumers in 2020. Visa offers strong long-term growth potential, as the company targets new multi-trillion-dollar transaction markets over the next several years. Investors should consider Visa as a means to capitalize on the global transition from cash and checks to electronic payments in all segments of the economy. This report’s price target for Visa is $374, which suggests Visa is currently trading at a $176 discount at its current price of $198. 


Industry Overview: 

Visa is the leading company in the payments technology industry. Payment technology companies provide other entities, such as companies and individuals, with the means to transfer funds safely and efficiently. Other prominent companies in the space include Mastercard and Paypall. The industry includes payments made with credit and debit cards, as well as any electronic transfer of funds from person to person, person to business, business to business, business to consumer, or government to citizen. The payments technology industry is expected to grow significantly in the coming years as digital repayments replace cash and more individuals in developing countries gain access to digital payment networks. 


Revenue Streams: 

Visa splits its revenue into four main categories (Data from 2020).


Service Revenues  $9.8B
Data Processing Revenues  $11B
International Transactions  $6.3B
Other Revenues  $1.8B


Service Revenues Overview: 9.8B

Service revenues are the fees Visa charges to clients for the use of Visa products. For example, a fee Visa charges to banks for supporting monetary transfers on their credit cards would be classified as service revenue. Service revenues are based on the amount of money that is transferred, not the number of transactions. So, a larger credit card issuer would pay more in service revenues than a small fintech startup like because the larger bankmoves more money with its credit cards. As Visa breaks into new monetary transfer markets and continues to expand the total dollar amount of transactions it facilitates, service revenues are expected to increase. 


Data Processing Revenues Overview: 11B

Data processing revenues are fees Visa collects for authorizing, clearing, settlement, and other services that facilitate transaction and information processing. These fees are separate from service revenues and scale with the number of transactions that Visa executes, because data processing fees are collected at each transaction, regardless of its size. Similar to service revenues, entrance into new transfer markets and movement away from cash payments will only increase the number of transactions Visa facilitates, which will lead to an increase in data processing revenues. 


International Transactions Overview: 6.3B

International transaction revenues are generated from fees collected from transferring money across borders. Fees collected from currency conversion are also attributed to international transaction revenue. Due to the reduction in global travel caused by the Covid-19 pandemic in 2020, international transaction revenues decreased by approximately 20% in 2020. However, while there is no way to know exactly how much international transaction revenues will rebound until the 2021 annual report is released, strong quarterly earnings from Visa suggest international revenues have done well so far in 2021. 


Other Revenues Overview: 1.8B

Any revenues not covered by service revenues, data processing revenues, and international transaction revenues fall in the other revenues category. These revenues are primarily generated from Visa’s ‘value-added’ services, as well as licensing feeds, account holder fees, ect. Value-added services, such as fraud management and security, data solutions, and Visa consulting & analytics rose 18% in 2020. While other revenues do not represent a major portion of Visa’s revenues, they represent Visa’s ability to adapt, expand, and offer new services that are well received by consumers. 


Financials and Operating Leverage:

Visa has sustained consistent revenue growth in revenue, operating income, and net income for several years before 2020. Even with the Covid-19 pandemic, annual revenue only decreased by 5% and net income decreased by 10% in 2020. The company’s healthy financials are confirmed by its statement of cash flows. Visa has constant positive and growing cash flow from operations before 2020, relatively flat cash flows from investing, and negative cash flows from financing as a result of paying dividends to shareholders. In 2020, the only significant change on the cash flow statement was a reduction in operating cash flows of around 20%, which was primarily caused by decreases in international transaction revenues. Visa’s balance sheet highlights steadily increasing assets while maintaining a gradually increasing debt level. Overall, Visa’s financial statements suggest it is a financially stable and healthy company, which is a breath of fresh air in a market filled with sky high speculative valuations on non-profitable companies.   


Visa’s income statement is particularly interesting. The company’s total costs are mostly constant, varying between $7 and $8 billion per year. There is some slight fluctuation between years where revenue is higher or lower, but the company’s largely constant level of total costs suggests the vast majority of Visa’s costs are fixed. As a result, the company has a high degree of operating leverage. This is visible in the company’s high EBIT margin, as a dollar of revenue flows almost flows directly down to EBIT. As Visa makes more money, net earnings will grow at a faster rate than overall revenue growth, which makes Visa a very attractive and profitable investment if the company sees significant growth in revenue.


Catalysts for Growth:

Cash Payments 


According to Visa’s 2020 annual report, there are an estimated 18 trillion dollars worth of annual transactions executed with cash globally. Management indicates that one of Visa’s primary goals is continuing to shrink the amount of cash transactions to zero over the next several years. As a result, there is a very large pool of transactions available to Visa to fuel continued growth. These transactions would also fall within Visa’s existing cost structure, so new revenues would be attained at historically large margins.   


New Flows 


Visa is also looking to move into new monetary transaction markets. In the next few years, Visa hopes to expand its operations from mostly Consumer to Business (C2B), to include person to person (P2P), business to consumer (B2C), business to small business (B2b), business to business (B2B), and government to consumer (G2C) transactions. Visa estimates these combined markets generate $185 trillion in payment volume. While breaking into the person-to-person market will be difficult due to high competition, Visa is favorably situated to move into every other market. As a veteran of the industry, Visa has a reputation for fast, secure, and reliable payment movement. This brand recognition makes governments and large businesses more likely to look to Visa for electronic payments to replace wire transfers and checks rather than upstart competitors, who lack a reputation of facilitating fast, reliable, and secure transactions. While it is very difficult to know exactly how much of these markets Visa will be able to obtain, and what their cost structure in these markets will look like, one thing is clear. Visa is favorably situated to gain a significant market share in these markets. Secondly, moving into these markets will not cost Visa significant research and development or asset procurement – they already have all the infrastructure and systems necessary to support these markets from their current business. 


Risks and Mitigations:

While Visa is a strongly positioned and financially sound company, there are some risks to consider. The payment network space is a highly competitive environment – Visa leads the market, but faces stiff competition from companies like Mastercard and Paypal. There are also numerous new entrants into the payment network industry in the form of startups. These startups are at a significant disadvantage to Visa – gaining users, building a reputation for security, and building a reliable payment network take significant resources and time. However, given the volume of startups, there is a possibility that a small number could grow to significantly compete with Visa. 

Visa may also face pricing pressure on its services from major retailers. Visa, like all companies that provide payment services to credit and debit cards, charge vendors fees for facilitating the transfer of money from a customer to the vendor. Recently, large vendors have been complaining that these fees are too high, and Amazon took an unprecedented step of refusing to accept Visa cards in the U.K. While concerning, this is likely Amazon playing chicken with Visa to try and squeeze out a little more profit. In general, large vendors need Visa’s payment network and services to sell products, and Visa will continue to grow revenues as more people adopt electronic payments, even if they face some pricing pressure.


Valuation


Model Summary:

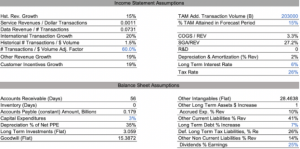
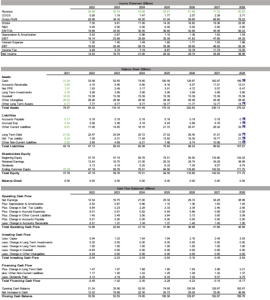
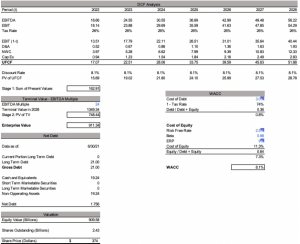
A three statement model was used to create a price target for Visa. The model is driven by assumptions about how Visa will take market share from cash translations and expand into the cash and ‘new flows’ market. With the market size information provided above, the model sets the total addressable payment volume at $203 trillion. The model assumes this amount remains constant, and Visa gains a set amount of the total market share each year. Based on how much market share we assume Visa captures over the next seven years, the model uses historical levels of revenue / $ transactions and revenue/ # transactions to forecast revenue. Costs and items on the balance sheet were projected forward to reflect historical levels as accurately as possible. The output of the three statement model is used to create a DCF analysis. The output of the DCF, with our TAM market capture set at a conservative 15% over 7 years, yields a stock price target of $374 per share, a premium of $176 over its current price of $198.

Model Inputs (blue indicates assumptions): 

Financial Statements: 

DCF Analysis: 

Nvidia Corporation

Authored by Spencer Huang

Nvidia Corporation (NASDAQ: NVDA)

Fall 2021


Overview

Nvidia Corporation is a company that needs no introduction. Founded in 1993 by Jensen Huang, the Santa Clara based technology company has grown dramatically over recent years, reaching a market capitalization of $810 billion (as of November 2021), which makes it the 7th largest US company by market cap. Its shares have more than doubled in the past year and have risen by nearly 1500% over the past five years, reflecting brilliant internal decision making, explosive industry growth, and continued investor optimism for the future. 


Nvidia by and large is a multinational company that specializes in the production of graphical processing units (GPUs), which are specialized chips that use parallel processing to accelerate graphics rendering.  Since Nvidia’s inception, the use and development of GPUs has established Nvidia as “the leader in visual computing”. Nvidia’s GPUs are most widely known for their use in gaming, but their chips also are used in many professional applications, such as engineering and architecture, as well as in chip systems for vehicles and robots. From its initial focus on 3D graphics and gaming, Nvidia has now branched out into artificial intelligence, data science, and augmented reality. 


Company analysis

Nvidia’s revenue streams and operating income can be broken down into three distinct categories: graphics, computing and networking, and all other. 


Nvidia’s graphics segment includes its GeForce GPUs , which are used in gaming and PCs, and its GeForce NOW game-streaming service. This is the largest segment of Nvidia’s revenue; for FY 2021, the Graphics segment made up 59% of Nvidia’s revenue for a total of $9.8 billion, representing a 28.7% increase from the previous year. The operating income of this segment also saw tremendous growth: it rose 41.2% in the last year to $4.6 billion.


Following that is the computing and networking segment, which comprises Nvidia’s Data Center platforms and their AI and high performance computing systems. This segment makes up the majority of Nvidia’s remaining revenue; for FY 2021, this segment represented 41% of total revenue. Revenues of $6.8 billion were good for a 108.6% increase from the previous year, while operating income of $2.5 billion represented a 239.3% growth from the year prior. 


Lastly, Nvidia has an “all other” category, which includes stock based compensation and other operating expenses. This amounted to an operating expense of $2.6 billion for FY 2021.


Investment catalysts

Nvidia’s continued emphasis on innovation and their position as an industry leader allow the company to take advantage of two recent trends in the tech industry, which will be explored below. The first development allows Nvidia’s graphics segment to push into a nascent industry and establish itself as a leader, while the second development makes use of Nvidia’s computing and network segment to work in tandem with other companies in their vision of a new future.


Beginning with the former, cloud gaming is largely seen as the future of the $175 billion gaming industry. The graphics on existing games are only as good as the processors inside the user’s computer or gaming system. However, with cloud gaming, these processors are stored in datacenters full of servers, with the game streamed to the user in real time. Companies that own data centers can fill them with high-end GPUs and then charge users a membership fee, allowing users to play games that their own devices otherwise couldn’t support. In fact, Nvidia estimates that there are over 1 billion PCs and devices that lack the processing capabilities required to play the latest games. To this end, Nvidia has launched their GeForce NOW service, which allows subscribers to play games over cloud servers equipped with Nvidia’s latest high-end gaming GPUs. Publicly launched less than two years ago, GeForce NOW has a subscriber base of over 12 million users, which compares similarly to Microsoft’s Game Pass (18m) and Electronic Arts’ EA Play (13m), two services that offer downloadable games (but not games to stream). Nvidia’s advantage lies in its potential, considering that it has a base of 140 million users who have a PC equipped with Nvidia graphics and could reasonably be expected to join the service, and in its equipment, considering its graphics cards are some of the most advanced in the industry. Additionally, Nvidia reached a partnership with EA to bring some of EA’s most popular games to GeForce NOW, signalling that Electronic Arts sees Nvidia’s cloud service as one with enormous potential growth. 


Secondly, shares in Nvidia rose significantly following Facebook’s earnings release on Oct 25, 2021. In the highly publicized release announcing the creation of Mark Zuckerberg’s “metaverse”, the social media giant conveyed its intention to dedicate “significant resources toward our augmented and virtual reality products and services” — essentially, towards the metaverse. Investors (rightfully) saw this as an opportunity for Nvidia, whose existing Omniverse augmented reality platform may serve as the basis for the Metaverse. It’s believed that most of the Metaverse revenues will be generated by the companies that build the infrastructure. Nvidia’s chips and processing power lends itself well to the construction of the infrastructure, putting it in a good position to capitalize on Meta’s plans for the Metaverse. 


Financials

Considering Nvidia’s recent gains since October 2021, it may seem that Nvidia is currently overvalued. Some analysts seem to think so, given that its current price is above consensus price targets.


Nvidia AMD Intel (INTC) Broadcom (AVGO) Qualcomm (QCOM)
Forward P/E 61.7 47.2 13.6 18.2 17.5
YOY Revenue growth +68.1% ~ +60% +2% +15% +56%
Gross margin  66.2% ~48% 54.5% 55% 60.7%


Nvidia’s price to earnings ratio is evidently very high compared to its peers in the semiconductor industry. While this may be concerning for investors, it’s important to realize that Nvidia has the underlying growth to justify such a high ratio. Based on key indicators such as its year over year revenue growth and gross margin, Nvidia is performing much better than its competitors, in particular AMD. In fact, in its recent earnings report (Q3, FY 2021), Nvidia posted record revenue growth in both its gaming and computing segments, blowing away expert predictions. 


Risks

For all its innovation and cutting edge technology, Nvidia doesn’t make its own chips. Most of its chips are contracted by Taiwan Semiconductor Manufacturing Company (NYSE: TSM), the world leader in semiconductor wafer production. Thus, if anything were to happen to TSMC, Nvidia’s graphics segment would be severely affected (as would the thousands of other corporate consumers of TSMC chips). TSMC is in an especially precarious geopolitical situation given that China has been eyeing reunification of the Taiwanese island with the mainland for quite some time. Should the conflict escalate and the Chinese invade the island by force, TSMC may be subjected to Chinese rule. Considering the animosity between China and the United States, it may be hard for TSMC to continue to supply Nvidia. However, this scenario remains hypothetical at best; Western powers have it in their best interest to keep Taiwan independent from China for the time being. Additionally, Nvidia has started contracting Samsung for some of their latest chips, reflecting an interest in diversification of suppliers. 


Secondly, the global supply chain shortage has hit the chip industry particularly hard. As a result, Nvidia has been unable to produce enough chips to satisfy the burgeoning demands of gamers and professionals alike; its new flagship RTX 3080 Ti Founders Edition chip was sold out in hours and currently fetches a steep resale value. To this end, Nvidia has proposed to acquire British manufacturer Arm for $40 billion to alleviate the shortage. While this move has been subject to antitrust concerns and awaits regulatory approval, it reflects Nvidia’s commitment to find long-term solutions to the supply shortage. 


Conclusion

Since its inception, Nvidia has experienced profound growth due primarily to continued innovation, allowing them to take advantage of emerging trends and exciting new opportunities. Nvidia shows no signs of deviating from this mission anytime soon, as evidenced by how their incursions into cloud gaming and augmented reality set them up well for developments in the gaming industry and Meta Platforms’ Metaverse, respectively. I would recommend buying shares of Nvidia and holding.

Scholastic Doesn’t Jump Off the Page

Authored by Justin Hartwig

November 24th, 2021

Scholastic Doesn’t Jump Off the Page

Overview:

Scholastic Corporation (SCHL) is the world’s largest publisher and distributor of children’s books, as well as a provider for educational materials in schools from pre-K through 12th grade. The company is in the publishing industry within the communication services sector. The stock is priced at $39.20 on November 24th, 2021, valuing the company at a market cap of $1.366 billion. Scholastic will release its earnings for the second quarter of FY2022 between December 15th and December 20th, 2021.


Introduction:

As many might remember from elementary school, the word “Scholastic” signalled a swell of anticipation and excitement. Each student would receive a book catalog advertising both new offerings and childhood staples. A few weeks later, the school library would be transformed into a world of books for students to explore. Unfortunately, like many things children love, we eventually outgrow these juvenile pursuits. So it follows with Scholastic. While children may love this publishing company, investors should not find much comfort in its current stock price. Trading at a price of $39 a share at writing, Scholastic Corporation is currently overvalued, and I would recommend investors sell the stock ahead of earnings in mid to late December 2021. Scholastic last reached a similar price in 2019—well before any pandemic-related disruptions to its business model. To justify this valuation, Scholastic will need to prove it can adequately recover from steep revenue declines during the pandemic while simultaneously staving off headwinds in its industry at large. The company’s second quarter 2022 earnings will be a key juncture at which at least one of those questions will be answered. With the market seemingly convinced that Scholastic is back on track, there is ample room for disappointment when December rolls around.  


Scholastic’s current stock price of $39 is nearly identical to its price in December 2019, despite its revenue and profit declines during the pandemic. Scholastic’s major revenue stream, publishing and distribution, suffered in a school environment that was either hybrid and online in many places. In addition, enhanced restrictions in many schools caused by COVID-19 likely had an effect on income from the company’s trademark book fairs and book clubs. In FY2019, the last year unaffected by the pandemic, Scholastic posted revenues of $1.654 billion. In FY2021, revenue was only $1.300 billion. As the pandemic subsides and elementary school-age children become eligible for vaccination, it is reasonable to assume that Scholastic’s revenues may return to previous levels. However, as alluded to above, merely returning to previous revenue is virtually required to justify its current valuation. Underwhelming earnings in the short term could reverse the stock’s fortunes. On a larger level,  it is difficult to imagine that Scholastic can overcome the anemic growth of the publishing industry writ large while simultaneously recovering from COVID-related business disruptions. 

The current price bakes in some assumptions about the growth of Scholastic’s business that may prove to be unfounded. Scholastic is not in a position where it can justify a higher stock price post-pandemic. Even before COVID, Scholastic was in no way a company known for its blockbuster success. In 2012, the company brought in over $2 billion. It has not done so at any point since then. Revenue declined from $1.742 billion in 2017 to $1.628 billion in 2018 before a negligible increase in 2019. In 2020 and 2021, revenue dropped precipitously. All of this is to emphasize that Scholastic is not a company aggressively pursuing growth; if anything, the company is sailing toward choppy seas regardless of pandemic conditions. Much of this feeble outlook is a result of general weakness within the entire physical publishing industry. As more and more consumers turn toward digital media, print publishing companies of all stripes have suffered. Analysts project a CAGR of 2% through 2025 in the print media industry—an underwhelming prediction to say the least. A middling company in a declining industry all adds up to a recipe for mediocrity, and mediocrity is incompatible with Scholastic’s current valuation.

Thesis: 

Scholastic is priced as if the pandemic is over when there still exists significant uncertainty around how receptive schools will be to reinvigorating their partnerships with Scholastic. Thus, Scholastic’s stock has few catalysts driving its current price and a substantial possibility for downward movement, especially before it reports earnings for the second quarter of FY2022. Since this quarter should encompass revenue from the first part of the school year, earnings will be a clue as to if Scholastic can follow through on its prior business performance post-pandemic. Already, there may be warning signs on the horizon. On the company’s first quarter 2022 earnings call, CEO Peter Warwick mentioned that bookings for Scholastic’s book fairs were still below pre-pandemic levels. One contributing factor could be plummeting school budgets exacerbated by the pandemic recession. In the face of budget cuts, book fairs could be one of the first items on the chopping block. Supply chain issues are yet another challenge to overcome in the recovery period. The company’s 2021 annual report highlighted supply chain disruptions in Asia as a potential source of higher costs in the coming year. With a business model focused on fast distribution, high fuel costs and general logistical breakdowns in shipping could result in increased operational costs. Additionally, the cost of paper—obviously key for a book publisher—has risen in the past year as supply declined during the pandemic. These supply chain factors present thorny obstacles for Scholastic to quash on its road to pre-COVID business.

An unexpected factor complicating Scholastic’s return to normality is inside the boardroom. The company recently mourned the passing of its longtime CEO and Chairman, Dick Robinson. Surprisingly, Robinson bequeathed majority control of the company to Iole Lucchese, a senior executive and possible romantic partner, instead of to his two sons. Robinson’s sons are currently exploring legal avenues to regain control of the family business, but Scholastic is currently outside of Robinson family control for the first time ever. At the same time, board member Warwick was made CEO. The executive suite shake-up represents yet more tumult as Scholastic attempts to return to pre-pandemic performance. Again, this turmoil presents only downside for a stock that seems to have a complete return to normal already priced in. 

Even if these challenges are overcome, Scholastic’s current valuation seems to be close to its ceiling in the last decade; in other words, there is much more room to fall than there is to rise. At the time of writing, the stock trades at a steep 296x P/E ratio in a media and publishing industry with an average ratio of 15x. Granted, that ratio is calculated off a lower EPS than should be expected in the future. If earnings per share were to rise to above 1, as they did in 2017 and 2016, then Scholastic may be more fairly valued than it currently appears. Unfortunately, the company has not reached those heights since, posting -0.14 and 0.44 dollars per share in 2018 and 2019 respectively. If we look at recent years, earnings data appears even worse, with the company earning -1.27 dollars per share in 2020 and -0.32 dollars per share in 2021. Even if the pandemic is ignored completely, the recent track record of Scholastic’s core businesses in non-COVID times does not inspire confidence around returning to the earnings of nearly half a decade ago. The price may be that of 2015, but the profits are not.  

Risks:

While I am bearish on Scholastic, there are risks that could make Scholastic an attractive buy opportunity. The company’s new leadership may deviate from the Robinson family’s long-standing policy to keep Scholastic independent. As consolidation takes the publishing industry by storm—look no further than Penguin Random House’s attempted merger with Simon & Schuster—Scholastic could be an attractive acquisition target for a bigger player in the industry. New leadership can also be an opportunity for innovation just as much as it can be a risk for uncertainty. As an executive, Lucchese was involved in a number of projects to expand Scholastic beyond its core business of print publishing. For example, she championed an ultimately-rejected venture to use Scholastic’s web features more effectively during the pandemic. Other digital features Lucchese embraced included expanding Scholastic’s literacy and educational material to include more online options, especially during the pandemic. If Scholastic can continue to  grow its digital capabilities, it could break from the rest of its print media rivals. In doing so, the company could avoid the worst effects of its industry’s broader decline and increase its own growth at the same time. While the company seems committed to its core business of print publishing and distribution, and no acquisition seems imminent as of now, the boardroom shakeup is only a few months old and plenty can change in the months and years to come.

Conclusion:

At its current price point, I believe Scholastic is overvalued given the company’s current revenue and weak industry growth profile. While the stock currently trades at a price nearly identical to its price four years ago, its revenue and earnings have not yet recovered to the same level. If a return to pre-pandemic business is baked into the stock price, this represents a significant opportunity in the event that Scholastic faces headwinds in its recovery. These challenges could range from school budget cuts, volatility in the executive suite, or a general decline in sales as digital media overtakes the print publishing industry. With this in mind, Scholastic has less room for continued upward trajectory and a lot of potential to fall in the near future. Therefore, I give Scholastic a sell rating.