By Marcus Hughes ’18

Professor Brianna Heggeseth explores the relationship between statistics methodology and real world data. Read on to learn more about her educational journey and research connecting DDT and obesity.
MH: What is your educational background?
BH: I’m originally from Minot, North Dakota. I completed my undergraduate degree in math with a statistics concentration at St. Olaf College in Minnesota. After that, I went to UC Berkeley and got a PhD in Statistics. I worked on my dissertation under my advisor Dr. Nicholas Jewell in the biostatistics department. My dissertation was on clustering longitudinal data with an application to childhood growth patterns. (Longitudinal data is repeated observations of certain factors over time in the hopes of studying change over time.)
MH: Why did you go into statistics?
BH: During my sophomore year, I was taking Real Analysis because I was a math major. At the same time, I took my very first statistics course. I realized that while I thought Real Analysis was beautiful and appreciated proving theorems, I much preferred to do my statistics homework. I enjoyed using data to address real world problems. So, I participated in the Summer Institute for Training in Biostatistics after my sophomore year. That gave me exposure to what a statistician does on a daily basis, all the career possibilities, and how ideas can be used in practically any field. After that program, I knew I had a passion for statistics.
MH: How did you end up at Williams?
BH: I went straight from my PhD to teaching. That’s unusual in the sciences but pretty common for Statistics as statisticians are in high demand at the moment. I knew I wanted to teach at a liberal arts college. I went to one and really loved the experience because I had a lot of interaction with my professors. I did research during my junior and senior years. During my graduate work at UC Berkeley, undergraduates asked me for recommendations instead of their professors because they had very little time with them. That wasn’t the experience I wanted to have teaching. I’m passionate about undergraduate education. Of all the liberal arts colleges in the US, there are two that have the best statistics programs: my alma mater, St. Olaf, and Williams. The fact that there were already three statisticians at Williams was very impressive; most small schools have zero, maybe one. When I visited, I was even further impressed by the bright students at Williams.
MH: How have you enjoyed your time at Williams?
BH: Coming to Williams gave me wonderful mentorship opportunities with senior faculty. The faculty in my department are truly amazing. They’re people I look up to. I also believe that I arrived at Williams at the right time. I was able to contribute to our new statistics major, learning how to propose classes and grow the program. I’ve really enjoyed it.
MH: What is your research focus?
BH: I study the behavior of statistical methods and apply those methods to real data. My dissertation was about methodology for longitudinal studies like I mentioned before. Since then, I’ve worked in collaboration with epidemiologists to explore public health questions using those methods. I think that studying both methods and applying them to data is really important. Often times, the methods help the application, and the application refines the methods. So, I do both.
MH: What kind of public health problems are you working on?
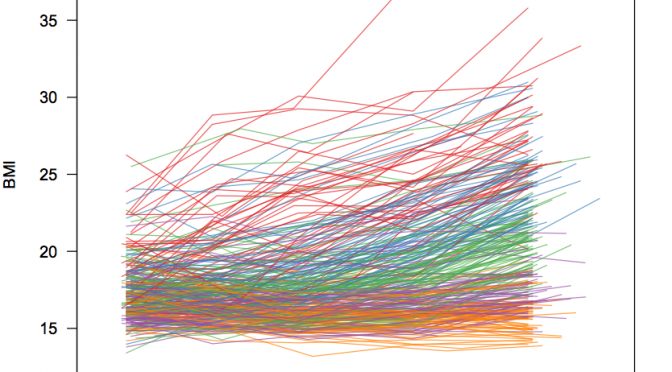
BH: My collaborators at Berkeley and I are interested in how in utero exposure to chemicals, specifically the pesticide DDT, impact a child’s growth and development. It’s hypothesized that this type of exposure is a factor leading to obesity. Endocrine-disrupting compounds, such as DDT, mimic estrogen and disrupt the metabolic process. While DDT has been banned in the US, it was routinely used in Mexico even as late as 1997. We’re examining a survey of immigrant families in California. The BMI of their children has been continuously measured for 10 years now. Generally, I’m interested in detecting factors that impact childhood growth.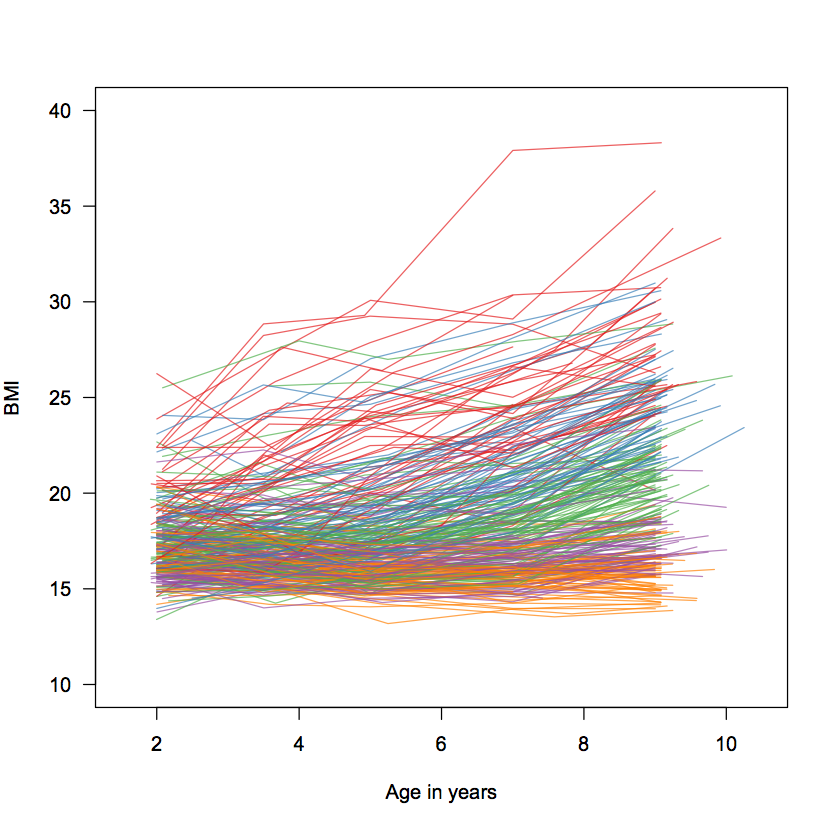
This graphic shows the change in body mass index (BMI) of approximately 300 children as they grow from 2 years old to 9 years old. The colors are assigned by Heggeseth’s model to detect different growth patterns.
MH: Have you collaborated with any students?
BH: Yes! Last summer, Matt Radford, a junior, worked with me to refine a proposed statistical method for modeling growth patterns and their relationships with factors such as chemical exposures that’s now getting published. My proposed method led to an unintended consequence in the dependency between observations, so he spent the summer thinking about how we could improve the modeling of that new dependent structure in the longitudinal observations. He was able to bring a math and physics background to come up with creative solutions to the problem. In the Spring, Stephanie Stacy, a sophomore, will be working with me to evaluate how effective our methods are for modeling nonlinear relationships between factors such as exposure and growth patterns.
MH: What is some advice you’d give science students at Williams?
BH: Interpreting data requires care; I highly recommend taking at least one statistics course to more deeply understand how to think with data. It is not just about doing calculations; we let the computers do that.
For more information on Prof. Heggeseth’s work you can visit her website http://sites.williams.edu/bch2/.