ASTRONOMY 402T – Spring 2018
Problems for Tutorial Week #9
1. The Einstein A-value for the H I spin-flip transition is 2.85 x 10⁻¹⁵ sec-1. How long (in seconds and in years) would you have to wait, on average, for an H I atom whose proton and electron have aligned spins to spontaneously emit a 21-cm photon? Given this result, how do you explain the ubiquity and strength of 21-cm radiation in the Galaxy?
2. a) Go through the argument that, even though the time between collisions in a cold H I cloud (T=150 K, nH=1 cm-3) is ~103 years, the electron distribution in the two levels involved in the 21-cm transition should be that predicted by LTE; i.e., the distribution given by the Boltzmann equation. Roughly what is the ratio between the spontaneous radiation time and the collision time?
b) In the case of deuterium, the analogous hyperfine transition has an A-value of 4.69x 10⁻¹⁷ sec-1. What is the corresponding lifetime of the upper level, in seconds and in years?
c) Under the same cloud conditions as in part a, calculate the approximate ratio between the spontaneous radiation time and the collision time. Do you expect an LTE distribution?
3. Draw the spectrum produced by a blackbody in the radio region of the spectrum on a log-log scale. For comparison, draw on the same graph a synchrotron emission spectrum. Now you should be able to describe how, spectrally, one is able to distinguish between the two. How else might one distinguish?
4. Think about why it is advantageous to locate ground-based infrared observatories at high altitude, or even in space: What are the main issues? Be as specific as you can, and include graphs and numbers that back up your argument.
5. In the Rydberg expression for hydrogen, the wavelength, λ, of Lyman α (in Angstroms) is given by:
1/λ = (1/911.8) x (1 – 1/4).
For heavier atoms that are fully ionized, the right side of the expression must be multiplied by Z2, where Z is the atomic number of the atom.
a) Calculate the Lyman α transition in fully ionized Fe. What region of the spectrum does this fall in?
b) Do the same for Si, S, Ar, and Ca.
Compare your wavelength results with those in the plotted spectrum below.
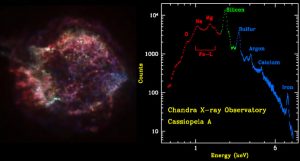
The red, green, and blue regions in this Chandra X-ray image of the supernova remnant Cassiopeia A show where the intensity of low, medium, and high energy X rays, respectively, is greatest.