ASTRONOMY 402T – Spring 2018
Problems for Tutorial Week #4
For all tutorial assignments you should come to your tutorial session prepared to work quantitative problems on the board. Bring your calculator so we can review and correct any errors. Remember to leave adequate room on your submitted work for your in-class additions, and for me to write comments and corrections. Thanks!
1. a) What is meant by a “resonance line” and why are these lines relevant in ISM studies?
b) Give examples of resonance lines observed in the ISM and include spectra (a URL is fine; we’ll look at it together in tutorial session.)
c) What can be learned from these lines?
2. What is meant by an “isoelectronic sequence” and how is such a concept useful?
3. What are “fine structure lines”? Explain how emission in those lines affects a nebula.
4. Explain the reason for neutral helium’s two families of energy levels.
5. a) What is “two-photon emission,” where do we see it, and why? What kind of spectrum does it produce?
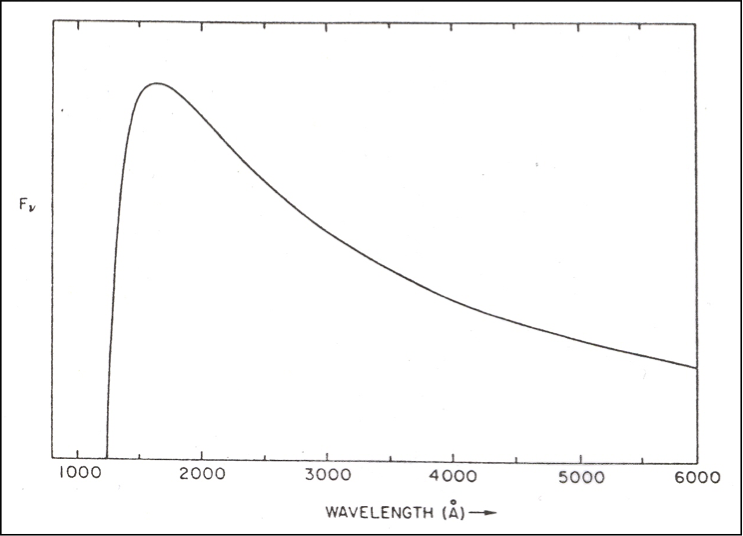
Above (top) is the graph of the two-photon emission spectrum from the class PowerPoint, which plots the flux (in frequency units) vs. wavelength. Above (bottom) is the graph of the probability of emitting a photon at any particular frequency, given in units of ν0, the frequency of Lyman α. (Ignore the dashed lines.)
b) Why are these graphs different, aside from the obvious fact that one plots wavelength and one plots frequency. Explain why each has the shape it does.
6. What do we mean by a “forbidden” transition? Explain, quantitatively, how it differs from an ordinary, “permitted” transition.
7. a) Draw a Grotrian diagram of the 5 lowest energy levels in a doubly ionized oxygen atom (O++). Label each level with its spectroscopic notation, and be ready to explain it. Also include the wavelengths of photons making transitions between pairs of these levels.
b) Do the same for singly ionized oxygen (O+).