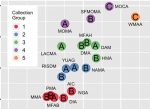
New Data Science Study analyzing artist diversity in major U.S. art museums:
- Link to article in PLOS ONE (published March 20, 2019)
- Check out our artist data base, reproduce our results (or explore further on your own) and look at our corresponding graphs in this interactive web app.
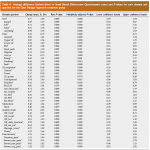
 Multiple comparison of 37 endpoints grouped in 6 domains, using paired-t-test as individual hypotheses tests:
“Decreasing recurrent bowel obstructions, improving quality of life with physiotherapy: Controlled study”, World J Gastroenterol (2018), Vol. 24, Issue 19, 2108-2119.

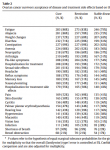
A nice application for testing Simultaneous Marginal Homogeneity for two dependent vectors of binary responses:
“Ovarian cancer survivors’ acceptance of treatment side effects evolves as goals of care change over the cancer continuum”, Gynecologic Oncology (2017), Vol. 146, Issue 2, 386–391
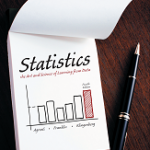
The new edition of Statistics: The Art and Science of Data Analysis (Agresti, Franklin, Klingenberg, 4th edition, Pearson 2017) has been published.
Check out the book’s website or the Table of Content.
Check out cool interactive web apps for introductory statistics courses.
Here is the link to the web apps organized by book chapter.
This blog showcases, among others, the use of various apps for the new introductory statistics curriculum, such as multivariate thinking or resampling approaches.
Meta Analysis and stratified 2×2 Tables: “A new confidence interval for the Mantel-Haenzsel risk difference” (Statistics in Medicine, 2014)
- Manuscript (with R code in Appendix)
- Poster (presented at IWSM 2013)
- Updated R code for inverting the score test and allowing (iterative) Miettinen-Nurminen weights
“Simultaneous confidence intervals for comparing margins of multivariate binary data”, Klingenberg and Satopää, Computational Statistics & Data Analysis, 64, 87–98, 2013.
R code: see Supplementary Materials
Confidence interval for the difference of two proportions: R code for
- The Miettinen-Nurminen Interval (performs “better” than the score): MN
The score interval: score_int
- This code is actually more general and let’s you compute the score interval for any linear combination of proportions! (See Andres et al. (2011) Stat. Meth. Med. Research.)
Note: These intervals are not what you would get from prop.test() in R. prop.test() returns the inferior clipped Wald interval with or without continuity correction. It should not be used. prop.test() can also not do the score test when the null difference of proportion is not 0.
“Simultaneous score confidence bounds for risk differences in multiple comparisons to a control“, Computational Statistics & Data Analysis, 56, 1079–1089, 2012.
Software: R code simRD


