PENS AND CRYSTALS
April 6, 2000
OLD CHALLENGE. How should you fence in two adjacent rectangular pens of given areas A, B with the least amount of fencing (including the fencing separating them)?
ANSWER (see Figure 1). Suppose A is less than or equal to B. If A equals B, the rectangles are identical and adjacent, a third longer in the direction of the shared wall, as rediscovered last week by Ms. Mattuck’s 8th graders at the Richmond School using Geometry Sketchpad. As A decreases down to B/2, the dimensions change until the larger region is square and the smaller region is only half as wide as tall. As A decreases below B/2, the shapes remain similar but the smaller rectangle shrinks up the side of the larger square. Incidentally, when A decreases below about B/5.34, the smaller region would prefer to jump into the corner of the larger square.
Figure 1. The most efficient way to fence in two prescribed areas goes through three types as the smaller area A decreases.
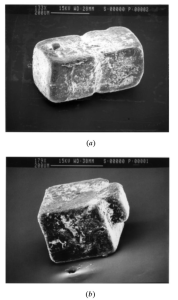
These results were proved in a more general context by college students Christopher French, Scott Greenleaf, Brian Wecht, Kristen Albrethsen, Charene Arthur, Heather Curnutt, Christopher Kollett, Megan Barber, and Jennifer Tice. Then they took electron microscope photos of table salt and found some similar behavior, probably for similar reasons of minimizing perimeter or energy (see Figure 2). I just described these results Saturday at the Lowell AMS meeting.
Figure 2. Double crystals of table salt show similar behavior for similar reasons.
NEW CHALLENGE. John A. Shonder of the Oak Ridge National Laboratory notes that “engineers are often interested in the average temperature over a day, because the amount of energy used in a building (and by extension, in an entire city) usually correlates well with daily average temperature. The National Weather Service reports what they call “daily average temperature” for various locations around the U.S., but this temperature is really just half the sum of the daily high and low temperature. At first glance, you wouldn’t think this would be a very accurate way of approximating the average. Who ever heard of approximating the integral f(x) over some interval by taking half the sum of the maximum and minimum values of f(x) on the interval, and then multiplying by the length of the interval? Yet that is exactly what the National Weather Service does. And what’s more, it’s a good approximation! I have some temperature data collected at 15-minute intervals over a three year period for a site in Louisiana. Using this data I was able to compare the actual daily average temperature (the average of 96 temperature measurements) with the average of just the high and low temperatures. Over a three year period, the standard deviation of the difference between these two averages is less than 2 degrees Fahrenheit.
My question is, why is this such a good way of approximating daily average temperature? Is there a mathematical explanation for it?”
QUESTIONABLE MATHEMATICS. Dan Ullman reports that music conductors refer to the second bar as “one bar after A,” but the tenth bar as “ten bars after A.” Ullman notes that “this is clearly inconsistent. At some fuzzy point (between 1 and 10?) the interpretation changes.”
Readers are invited to send in more examples of questionable mathematics.
Send answers, comments, and new questions by email to [email protected], to be eligible for Flatland and other book awards. Winning answers will appear in the next Math Chat. Math Chat appears on the first and third Thursdays of each month. Prof. Morgan’s homepage is at www.williams.edu/Mathematics/fmorgan.
THE MATH CHAT BOOK, including a $1000 Math Chat Book QUEST, questions and answers, and a list of past challenge winners, is now available from the MAA (800-331-1622).
Copyright 2000, Frank Morgan.


 Welcome to my blog. I also have a blog at the