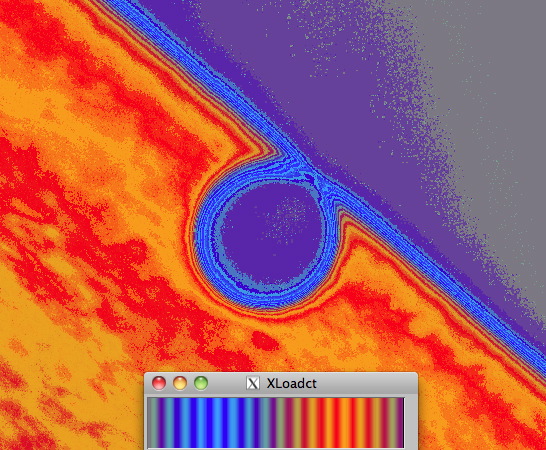
The same data, limited as only 8-bit JPG, stretched linearly over the imaging dynamic range of 25 to 158 DN using a contouring color table that stretched orange-to-blue at mid-range, and modulated top-to-bottom with 6.25% intensity contour intervals peak-to-peak. That may not be optimal (yet), but the ‘black drop’ signature is there. Compare, just for example to Fig 6E of http://nicmosis.as.arizona.edu:8000/PUBLICATIONS/ICARUS_TRANSIT.pdf .
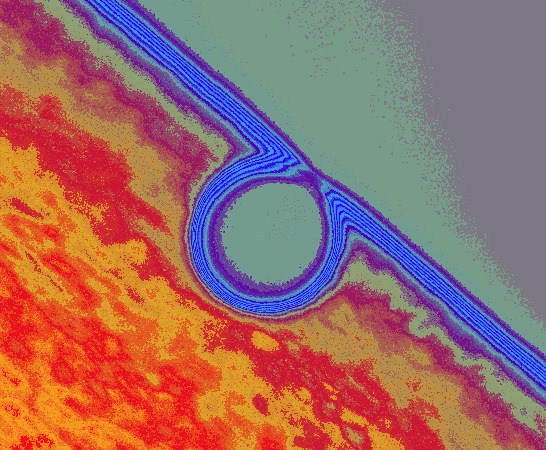
With some dynamic range compression just by a log10 stretch instead from [1.4] to [2.2] dex counts, here are the same data with a slightly different visualization.