A total of 75 people took part in the online card sort. Members of the study groups (Focus Group, ISG, and ITC) were invited to participate within their groups. Then the study was opened to campus groups (students, faculty, and staff) via Daily Messages and WSO Announcements, and a group of alumni were invited to participate.
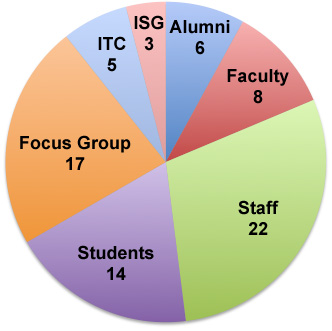
All participants according to “self-identified” groups
 |
This pie represents all of the groups – study and campus – who participated in the study. One-third of the participants (Focus Group, ITC, and ISG) completed the card sort as part of a study group. |
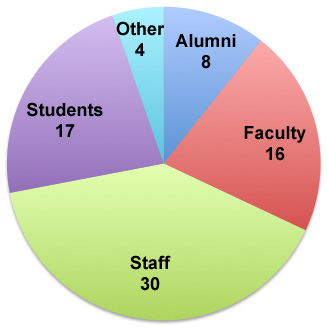
All participants reclassified into “campus groups”
 |
Members of the study groups were reclassified as students, faculty, alumni, and staff. Where a participant is a member of more than one campus group, we chose the one that represents best the hat they wear when using the college website. “Other” represents high school guidance counselors and peers at other colleges who were invited to participate as part of the Focus Group. |
| Group | # in study | % of study | Total # | % of total |
|---|---|---|---|---|
| Faculty | 16 | 21 | 300 | 5.5 |
| Students | 17 | 23 | 2,200 | 0.08 |
| Staff | 30 | 40 | 750 | 0.04 |
| Alumni | 8 | 10 | 20,000 | 0.0004 |
Of the total participants in this study, Faculty represent 21%, Students 23%, Staff 40%, Alumni 10%, and Other 5%.
The percentage these participants represent of total campus populations are depicted in the chart above. Faculty participants represent 5.5% of the total faculty population, etc.
We do not have stats on the actual percentage of website use by any of these groups.
Who is this report about?
For most of the pages included in this report, five groups are represented: Students, Faculty, Staff, Alumni, and All. “All” includes the four campus groups as well as the four participants in the “Other” group shown the second pie chart above.
Next: The Study