Visitor Technology
Williams
World
.
Browser:
Safari – 37%
Firefox – 24%
IE – 22%
Chrome – 15%
Firefox – 24%
IE – 22%
Chrome – 15%
Firefox – 39%
Chrome – 32%
IE – 21%
Safari – 4.2%
Chrome – 32%
IE – 21%
Safari – 4.2%
.
Platform:
Mac – 48%
Windows – 45%
Mobile – 5%
Windows – 45%
Mobile – 5%
Windows – 84%
Mac – 9%
Mobile – 1%
Mac – 9%
Mobile – 1%
.
Screen resolution:
1440 x 900 – 11%
1280 x 1024 – 9%
1280 x 800 – 34%
1024 x 768 – 8%
1280 x 1024 – 9%
1280 x 800 – 34%
1024 x 768 – 8%
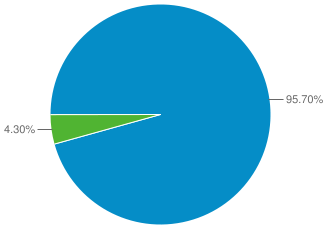
Mobile
 Non-Mobile Device Visits – 4,385,809
Mobile Device Visits – 197,103
Of these mobile devices, Apple iOS devices seem to be the majority of visits.
- Apple iPad – 45,315
- Apple iPhone – 44,417
- (not set)* – 17,416
- Apple iPod Touch – 6,768
- Motorola DroidX – 2,925
- HTC ADR6300 Incredible – 1,981
- Motorola Droid 2 – 1,302
- RIM BlackBerry 8530 Curve – 1,155
- Verizon Droid2 – 1,118
- Verizon Droid – 953
- RIM BlackBerry 9630 Tour – 862
- Motorola MB860 Atrix – 816
- HTC EVO 4G – 761
- HTC Desire ADR6200 – 541
- RIM BlackBerry 9700 Bold – 522
- Samsung SCH-I500 Fascinate – 495
- RIM BlackBerry 9650 Bold – 421
- LG Ally – 366
- Samsung SPH-D700 Epic 4G – 339
- Samsung SGH-I897 Galaxy S Captivate – 302
* – this can denote either a “jailbroken” iOS device or possibly a device running iOS 5. As of this report, the “not set” mobile device metric seems to have risen to coincide with the release of iOS 5.
Location
Below is the traffic to the Williams site by location.
-
United States
- Williamstown 1,975,955
- New York 187,710
- North Adams 123,321
- Springfield 62,291
- Boston 60,213
- Washington 40,176
- Chicago 31,450
- Los Angeles 29,193
- Chicopee 26,933
- Cambridge 25,383
- Adams 21,897
- Bennington 19,834
- San Francisco 19,275
- Pittsfield 18,023
- Albany 17,570
- Philadelphia 17,166
- Northampton 15,249
- Seattle 14,714
- Saratoga Springs 12,931
- Amherst 12,361
-
Singapore
- Singapore 9,103
-
South Korea
- Seoul 8,529
-
China
- Beijing 8,102
-
Hong Kong
- Hong Kong 7,986
-
Canada
- Toronto 7,366
-
United Kingdom
- Oxford 6,875
-
China
- Shanghai 4,870
-
France
- Paris 4,844
-
Nepal
- Kathmandu 3,270
For a more detailed report of the top 500 locations by city including bounce rate, pages per visit and more, click here (PDF)